
Disks and RAID
Disks are where a host fails slowly and then all at once. The doctor watches how fast each one fills, each drive’s SMART health, and the state of every software RAID array - including Synology’s SHR layout.
How fast, not just how full
Section titled “How fast, not just how full”“92% full” is close to useless on a host. It can sit there for a year or be gone by Friday and the number reads the same either way, so the threshold gets moved and nothing is answered.
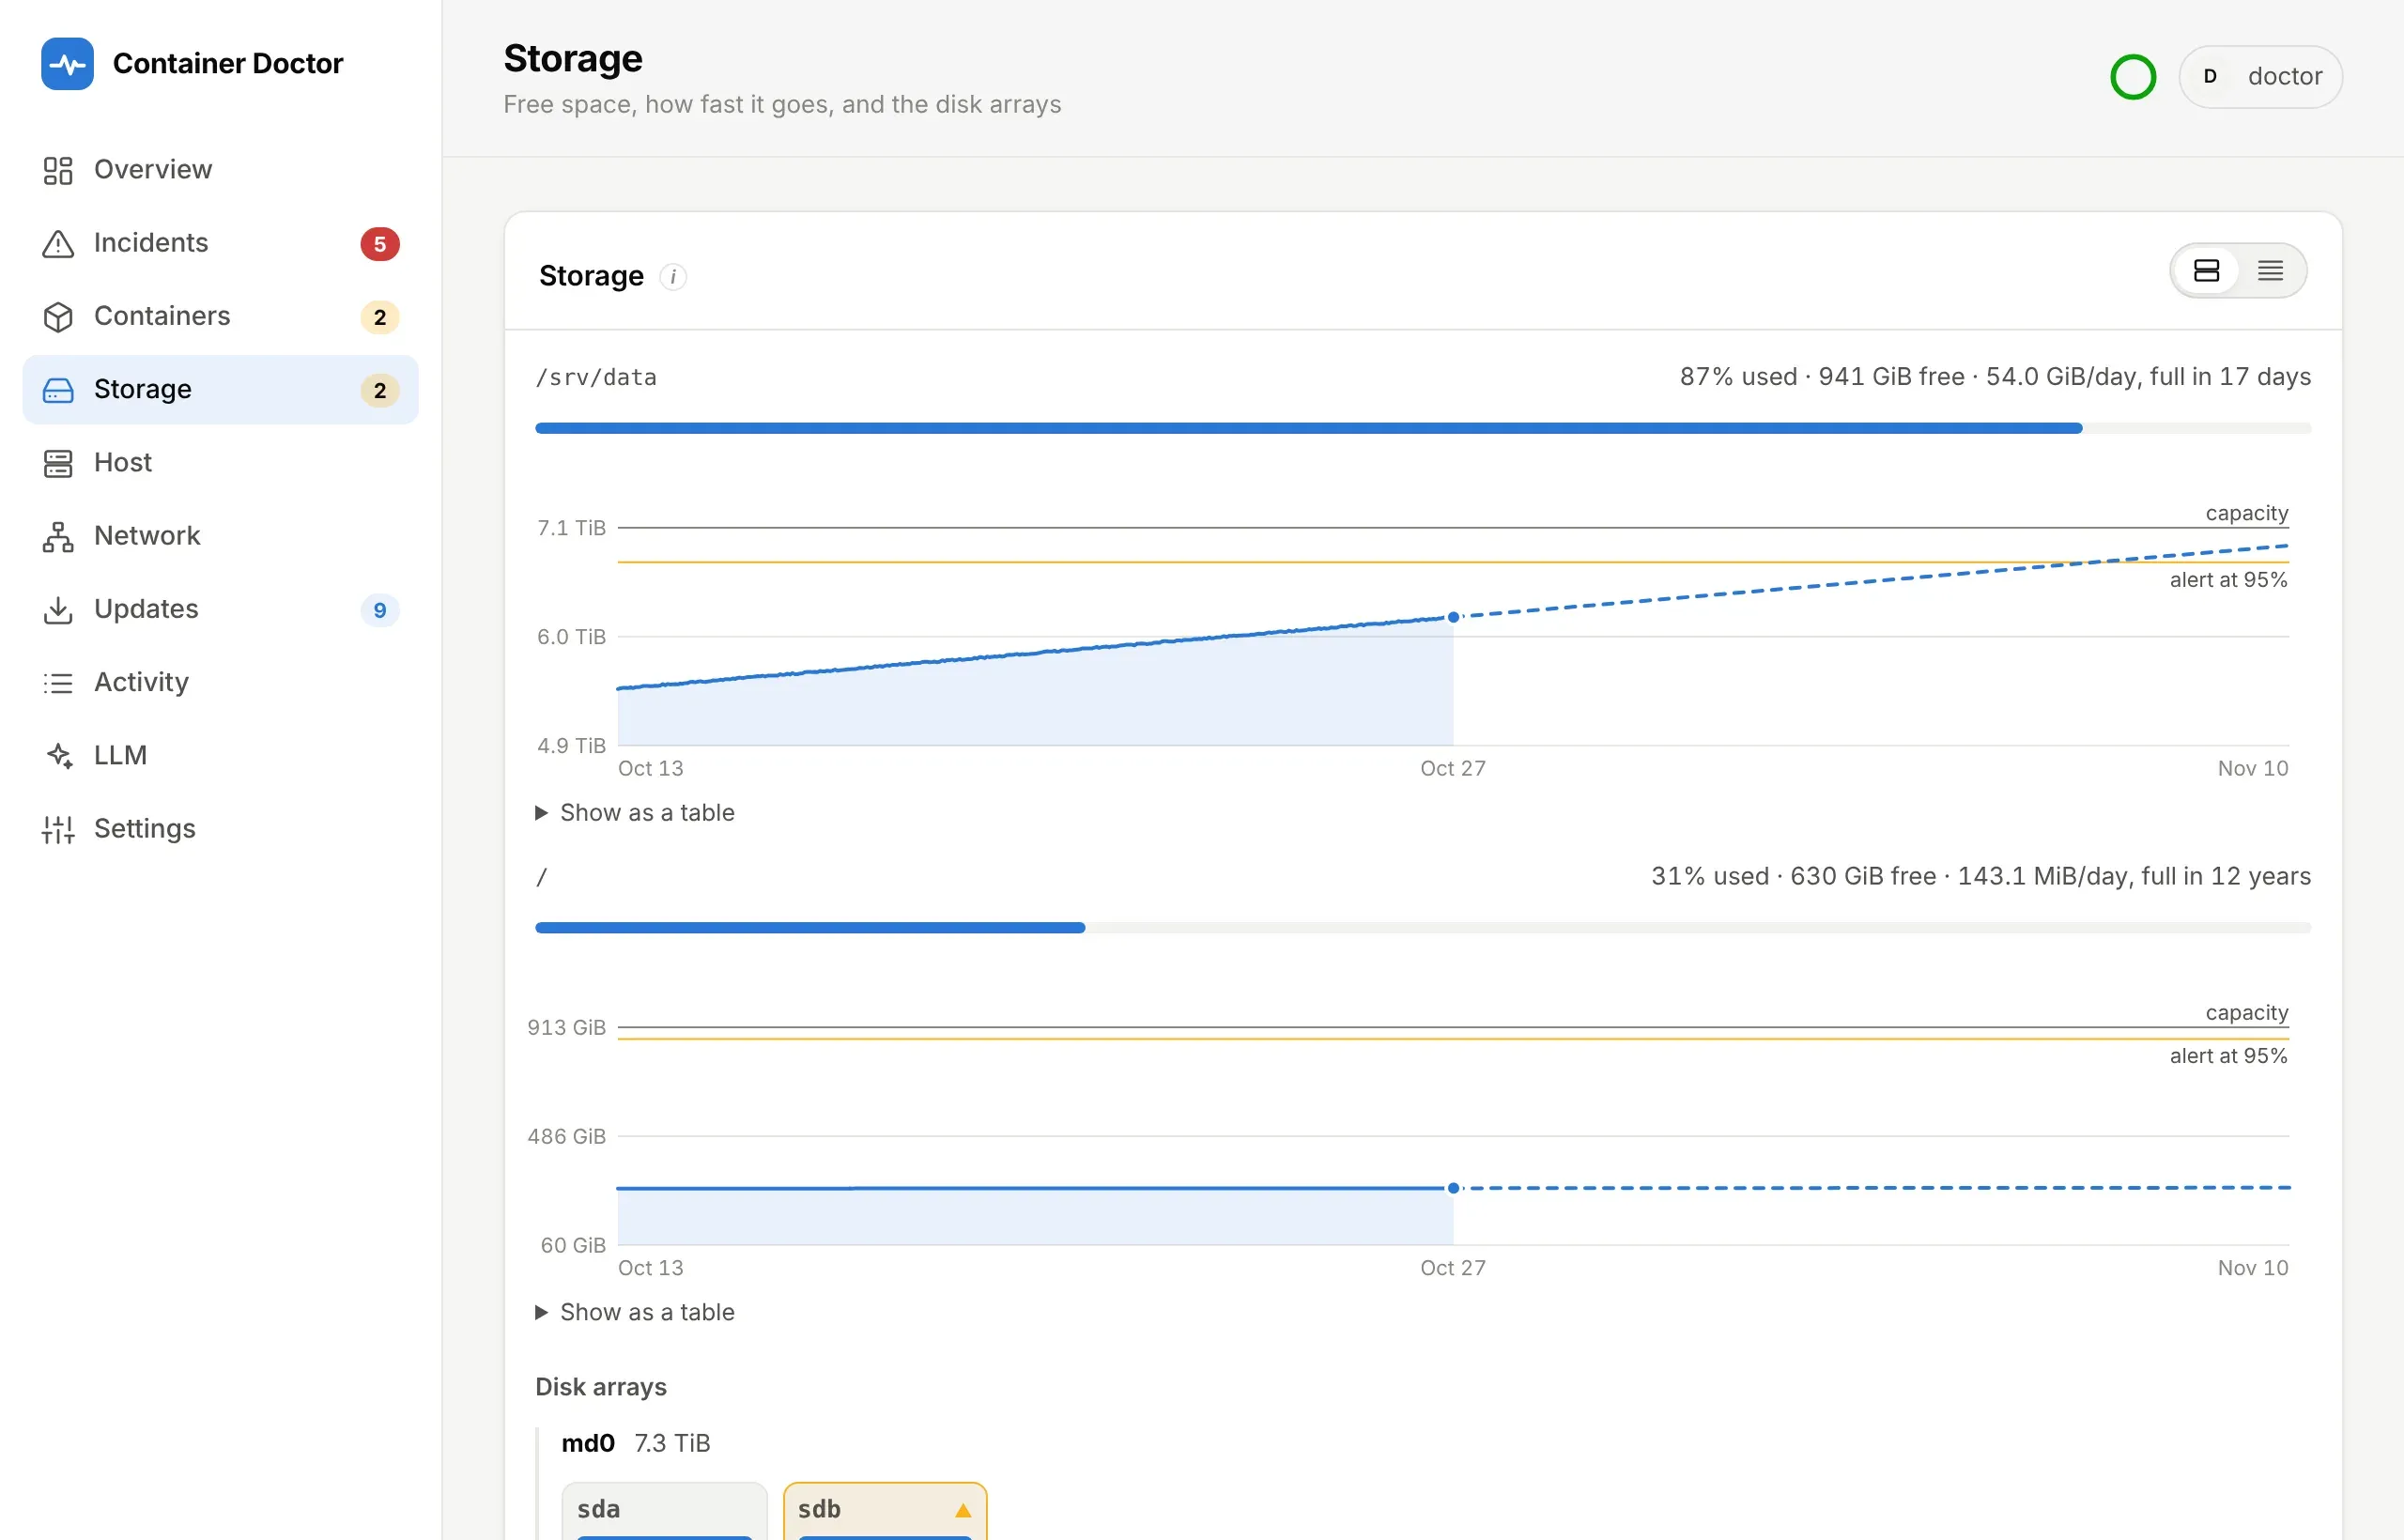
One sample per path per hour, least squares over the last fortnight, and two figures that do answer it: a rate and a date. “/data is filling at 3.7 GiB/day — full in about 31 days” is a decision. “92% full” is not.
- Least squares over the window, not first-to-last, so a restart that frees a few gigabytes bends the line instead of resetting it.
- Projected from the most recent reading, not the fitted one, because the question is how long from now.
- A trickle is not a trend. Under a megabyte a day is treated as no movement rather than extrapolated to a date three centuries out.
- Samples are bucketed hourly, so polling every 30 seconds does not become 2880 rows a day.
- Full means no free space left, the way the percentage counts it. The filesystem’s raw total also holds the blocks reserved for root, which no container will ever fill, so projecting to it promised days that do not exist.
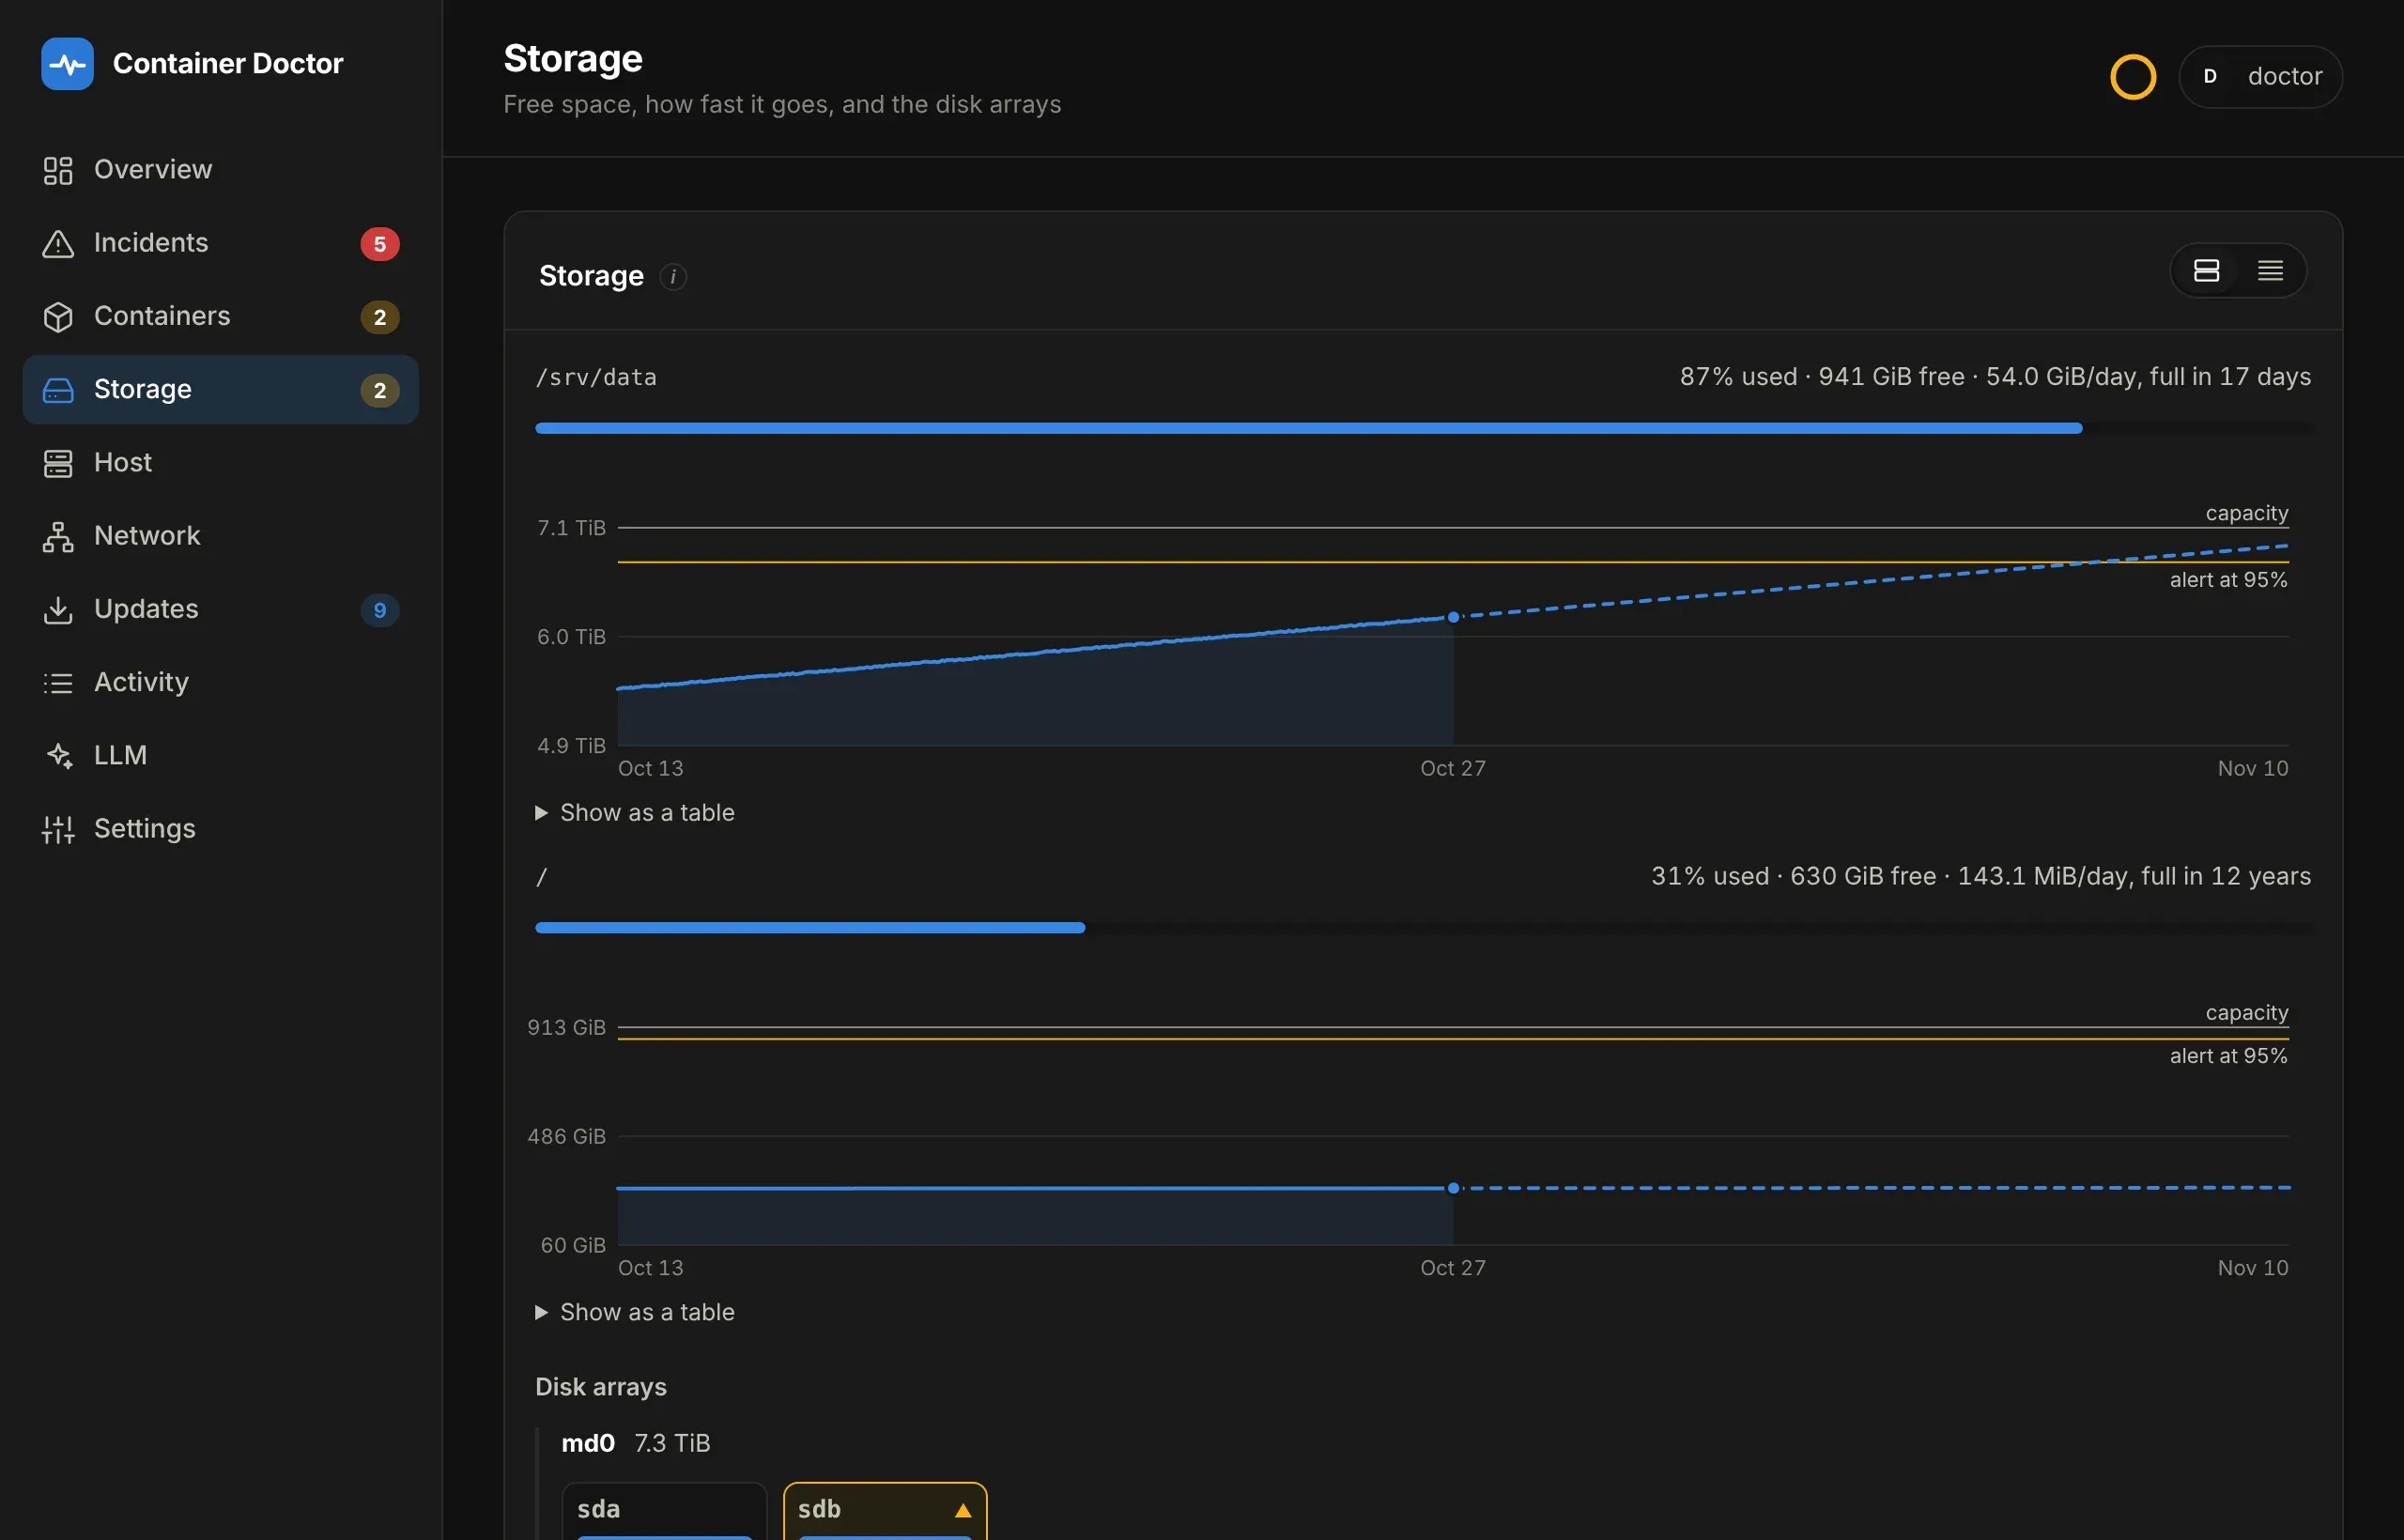
The Storage panel draws it: two weeks of samples, and a dashed line carrying the fitted rate forward from the latest reading to capacity or as far ahead as the history reaches back, whichever comes first. Hover or tap for any hour’s reading; Show as a table lists the last reading of each day.
disk_filling is a separate rule from host_disk_pressure on purpose: a disk
can be 60% full and gone by Friday, or 92% full and stable for years. Only the
forecast rule fires on the first; only the threshold rule fires on the second.
| Variable | Default | What it does |
|---|---|---|
DOCTOR_DISK_FORECAST_DAYS |
21 |
How far ahead is worth an incident |
DOCTOR_DISK_FORECAST_CRITICAL_DAYS |
5 |
Inside this, the incident is critical |
DOCTOR_DISK_TREND_WINDOW_DAYS |
14 |
How much history the line is fitted to |
DOCTOR_DISK_SAMPLE_MINUTES |
60 |
One stored reading per path per bucket |
DOCTOR_RAID_ERRORS_PER_DAY |
10 |
New corrected read errors on one drive within 24 hours that make its warning critical; 0 never escalates |
DOCTOR_RAID_ERRORS_DAYS |
7 |
How long a drive warns after its last newly corrected read error |
It takes four samples to draw a line, so a freshly deployed doctor says nothing about trends for the first few hours. That is the correct answer, not a gap.
Watching every volume
Section titled “Watching every volume”The doctor reads free space per filesystem, through a path it can see:
statvfs on /data answers for the whole volume /data lives on, and for
nothing else. A host with several volumes - an SHR pool, a mirror, an NVMe
pool - needs one watched path on each, and each gets its own row, meter,
chart and forecast on the Storage page, named after its volume (/data ·
Volume 3) when the disk arrays are read.
Mount an empty folder on each other volume, read-only, and list it beside
/data. Create the folders first: Docker on a Synology does not create a
missing one, and the deploy fails with Bind mount failed: ‘…’ does not
exist.
sudo mkdir -p /volume1/@container-doctor-disk /volume2/@container-doctor-diskvolumes: - /volume3/docker/container-doctor:/data - /volume1/@container-doctor-disk:/disks/volume1:ro - /volume2/@container-doctor-disk:/disks/volume2:roDOCTOR_DISK_PATHS=/data,/disks/volume1,/disks/volume2On a Synology, put each folder at the volume’s root with DSM’s @ prefix, as
DSM’s own @docker and @appstore are: outside every shared folder, so File
Station, SMB clients and media scanners never list it, and moving or
deleting a shared folder cannot take it along. On another host, any empty
folder on the volume will do. Never mount a volume’s root for this: see
What it can read of your host.
A volume with no watched path says free space not watched under Disk
arrays, with the lines to add for the ones left: the mkdir, the mounts and
DOCTOR_DISK_PATHS as it would read with them, ready to copy on a Synology,
where each volume’s folder is /volumeN. Its size and filesystem still
show; only how full it is takes the mount.
A path moved to another volume - its data folder copied to a new pool and the mount pointed there - keeps its name but not its history. Each reading records which filesystem answered, and the chart and the forecast start again at the move rather than reading a 24 TiB drop as a clean-up; a line under the chart says when. Readings from before the doctor kept the filesystem are told apart by size: a volume grows but never shrinks.
Drive health
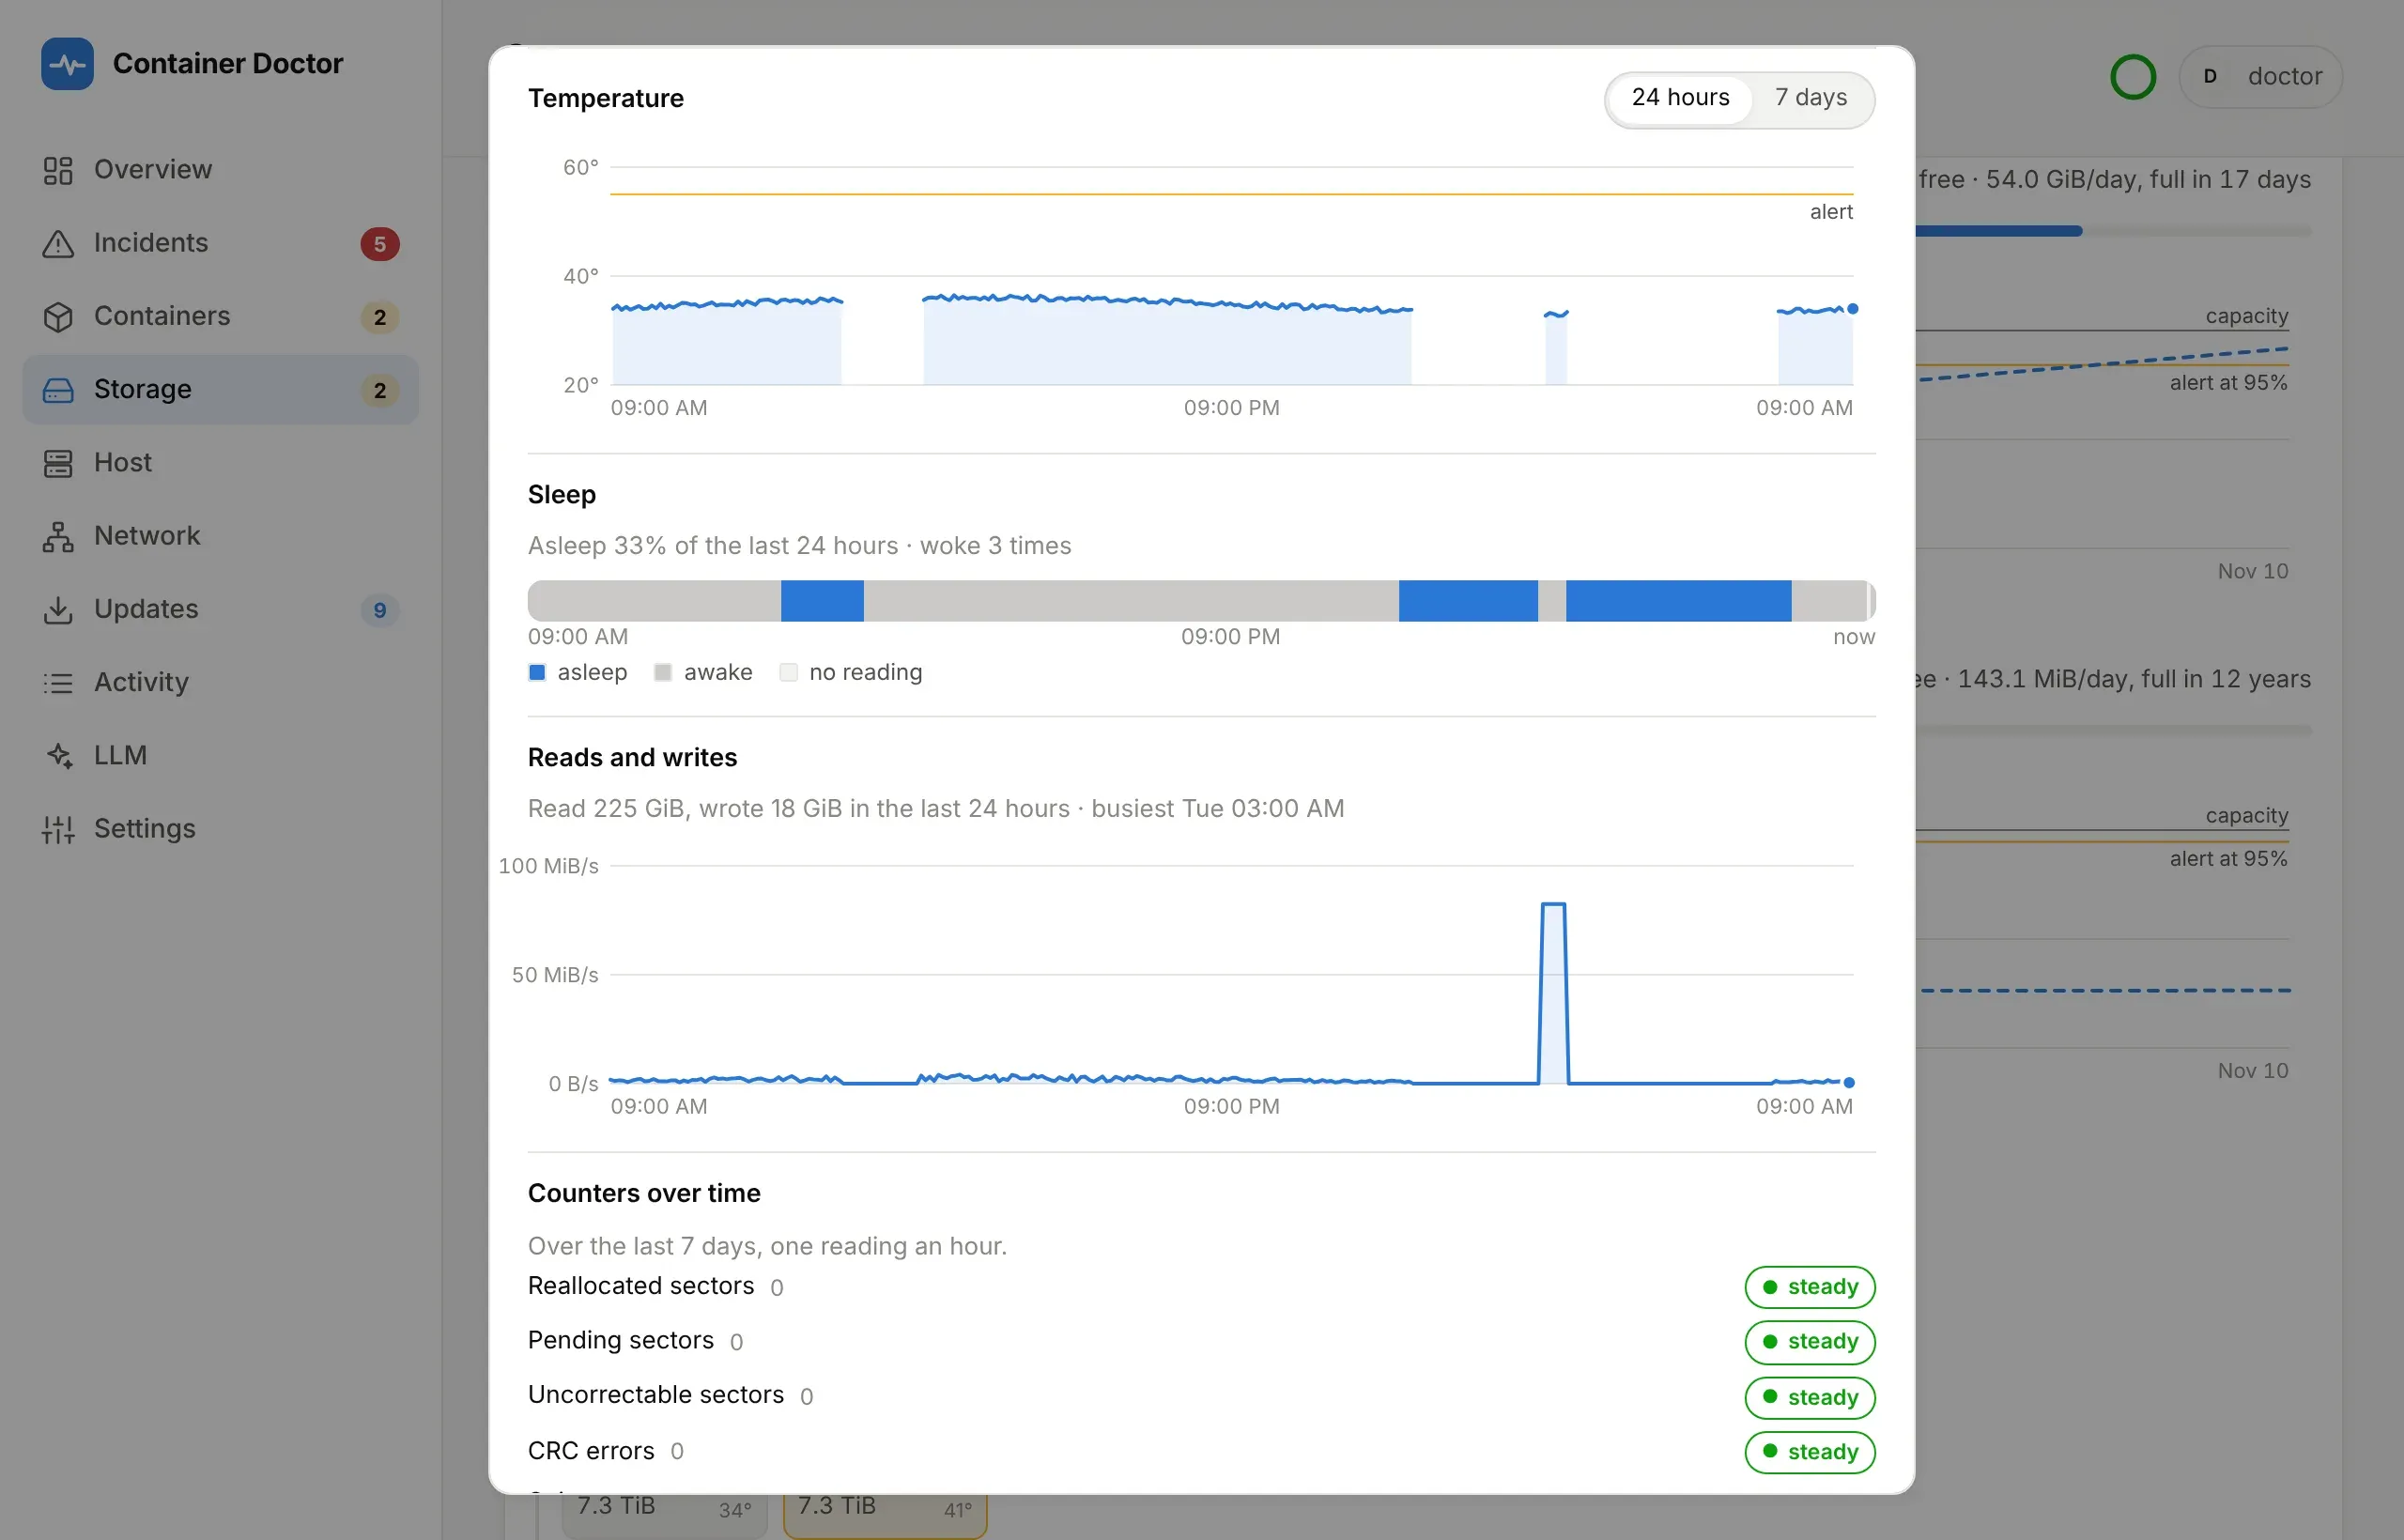
Section titled “Drive health”The Drive health panel on the Storage page shows each drive’s own account of itself, read with smartctl: health verdict, temperature, age, and the counters that move first on a failing drive. Each drive’s temperature is kept too, at the Host charts’ resolution, and charted in the drive’s details. It costs the drives nothing: the sidecar reads SMART every five minutes anyway and skips a drive that is asleep, so history never keeps a disk from spinning down. The chart always spans the whole range you pick, 24 hours or 7 days, up to now: where there are no readings - the drive asleep, the sidecar or the doctor down - it leaves a gap rather than drawing a line across it.
| Drive | Warning | Critical |
|---|---|---|
| Hard disk | Any reallocated, pending, offline-uncorrectable or reported-uncorrectable sector; new interface CRC errors; at 55 °C or more | It reports itself as failing |
| SATA SSD | As a hard disk, and 90% of its rated endurance used | As a hard disk |
| NVMe | Media errors; 90% of its rated endurance used; at 70 °C or more | A controller critical warning; spare capacity at or below its threshold |
Select a drive on the Storage page for everything else SMART says about it:
model, serial and firmware, whether it is an SSD or how fast it spins, its
link speed, power-on time and power cycles, how often a hard disk has spun up,
how much it has written and read over its life, the share of an SSD’s rated endurance used, and each counter on
its own - reallocated, pending and uncorrectable sectors, CRC errors, head
parks, the errors it logged itself and failed self-tests - a 0 included.
A SATA drive reports its lifetime writes in a vendor attribute whose name
gives the unit (Total_LBAs_Written, Host_Writes_32MiB, Host_Writes_GiB),
and an SSD its wear as a normalised value that counts down from 100
(Wear_Leveling_Count on a Samsung, Percent_Lifetime_Remain on a Crucial);
a drive that reports neither shows neither. DOCTOR_SMART_WEAR_PCT sets the
endurance warning for SATA SSDs and NVMe alike.
CRC errors point at the cable or the bay, not the disk, and a drive keeps its count forever. So the first count seen is the baseline, and only new ones are reported. Each drive gets one incident however its numbers move. It closes once nothing is wrong with the drive any more, for example once pending sectors have been remapped. Drives are read every five minutes, and a drive asleep is skipped rather than woken.
The sidecar. Reading SMART takes raw access to the disks, and the doctor
deliberately has none. A second container in this stack, doctor-smart,
does that and nothing else. It is opt-in, behind the Compose profile smart:
start the stack with docker compose --profile smart up -d, or set
COMPOSE_PROFILES=smart in the stack environment. Without it the doctor works
normally and the panel notes that the sidecar is not answering. It runs the upstream
smartctl_exporter
unchanged, and the doctor reads its metrics page over the internal network.
It is set up as follows:
CAP_SYS_RAWIOto send SMART commands.CAP_SYS_ADMINtoo, because NVMe answers through its admin command set; drop it if you have no NVMe drives.- The host’s
/dev, read-only, with a device cgroup rule allowing block devices. smartctl opens a drive read-write to talk to it. - Every other capability dropped, a read-only filesystem, no published port, and only the doctor’s internal network, so no route out.
That is still raw access to the disks, so it is the one container here that could read them. Keeping it to a stock image with no network beyond the doctor is the containment.
It finds the drives itself: DSM’s sataN bays and NVMe drives, or sdX on
older models. If they are not found, list them with DOCTOR_SMART_DEVICES,
for example /dev/sata1;sat /dev/sata2;sat. DOCTOR_SMART_URL=off turns
drive health off.
The sataN bays are read as SATA (;sat), not left to smartctl to guess. DSM
reports the first word of a drive’s model as its vendor, so every Western
Digital (WDC WD60EFRX-...) looks like a SCSI disk from vendor “WDC”, and
smartctl’s guess reads only its identity: no verdict, no counters, a
temperature of 0. A Seagate (ST6000VN001-..., no space) comes through as
vendor “ATA” and is guessed right. A drive read that way shows no data on
the Storage page, never healthy.
Drive sleep
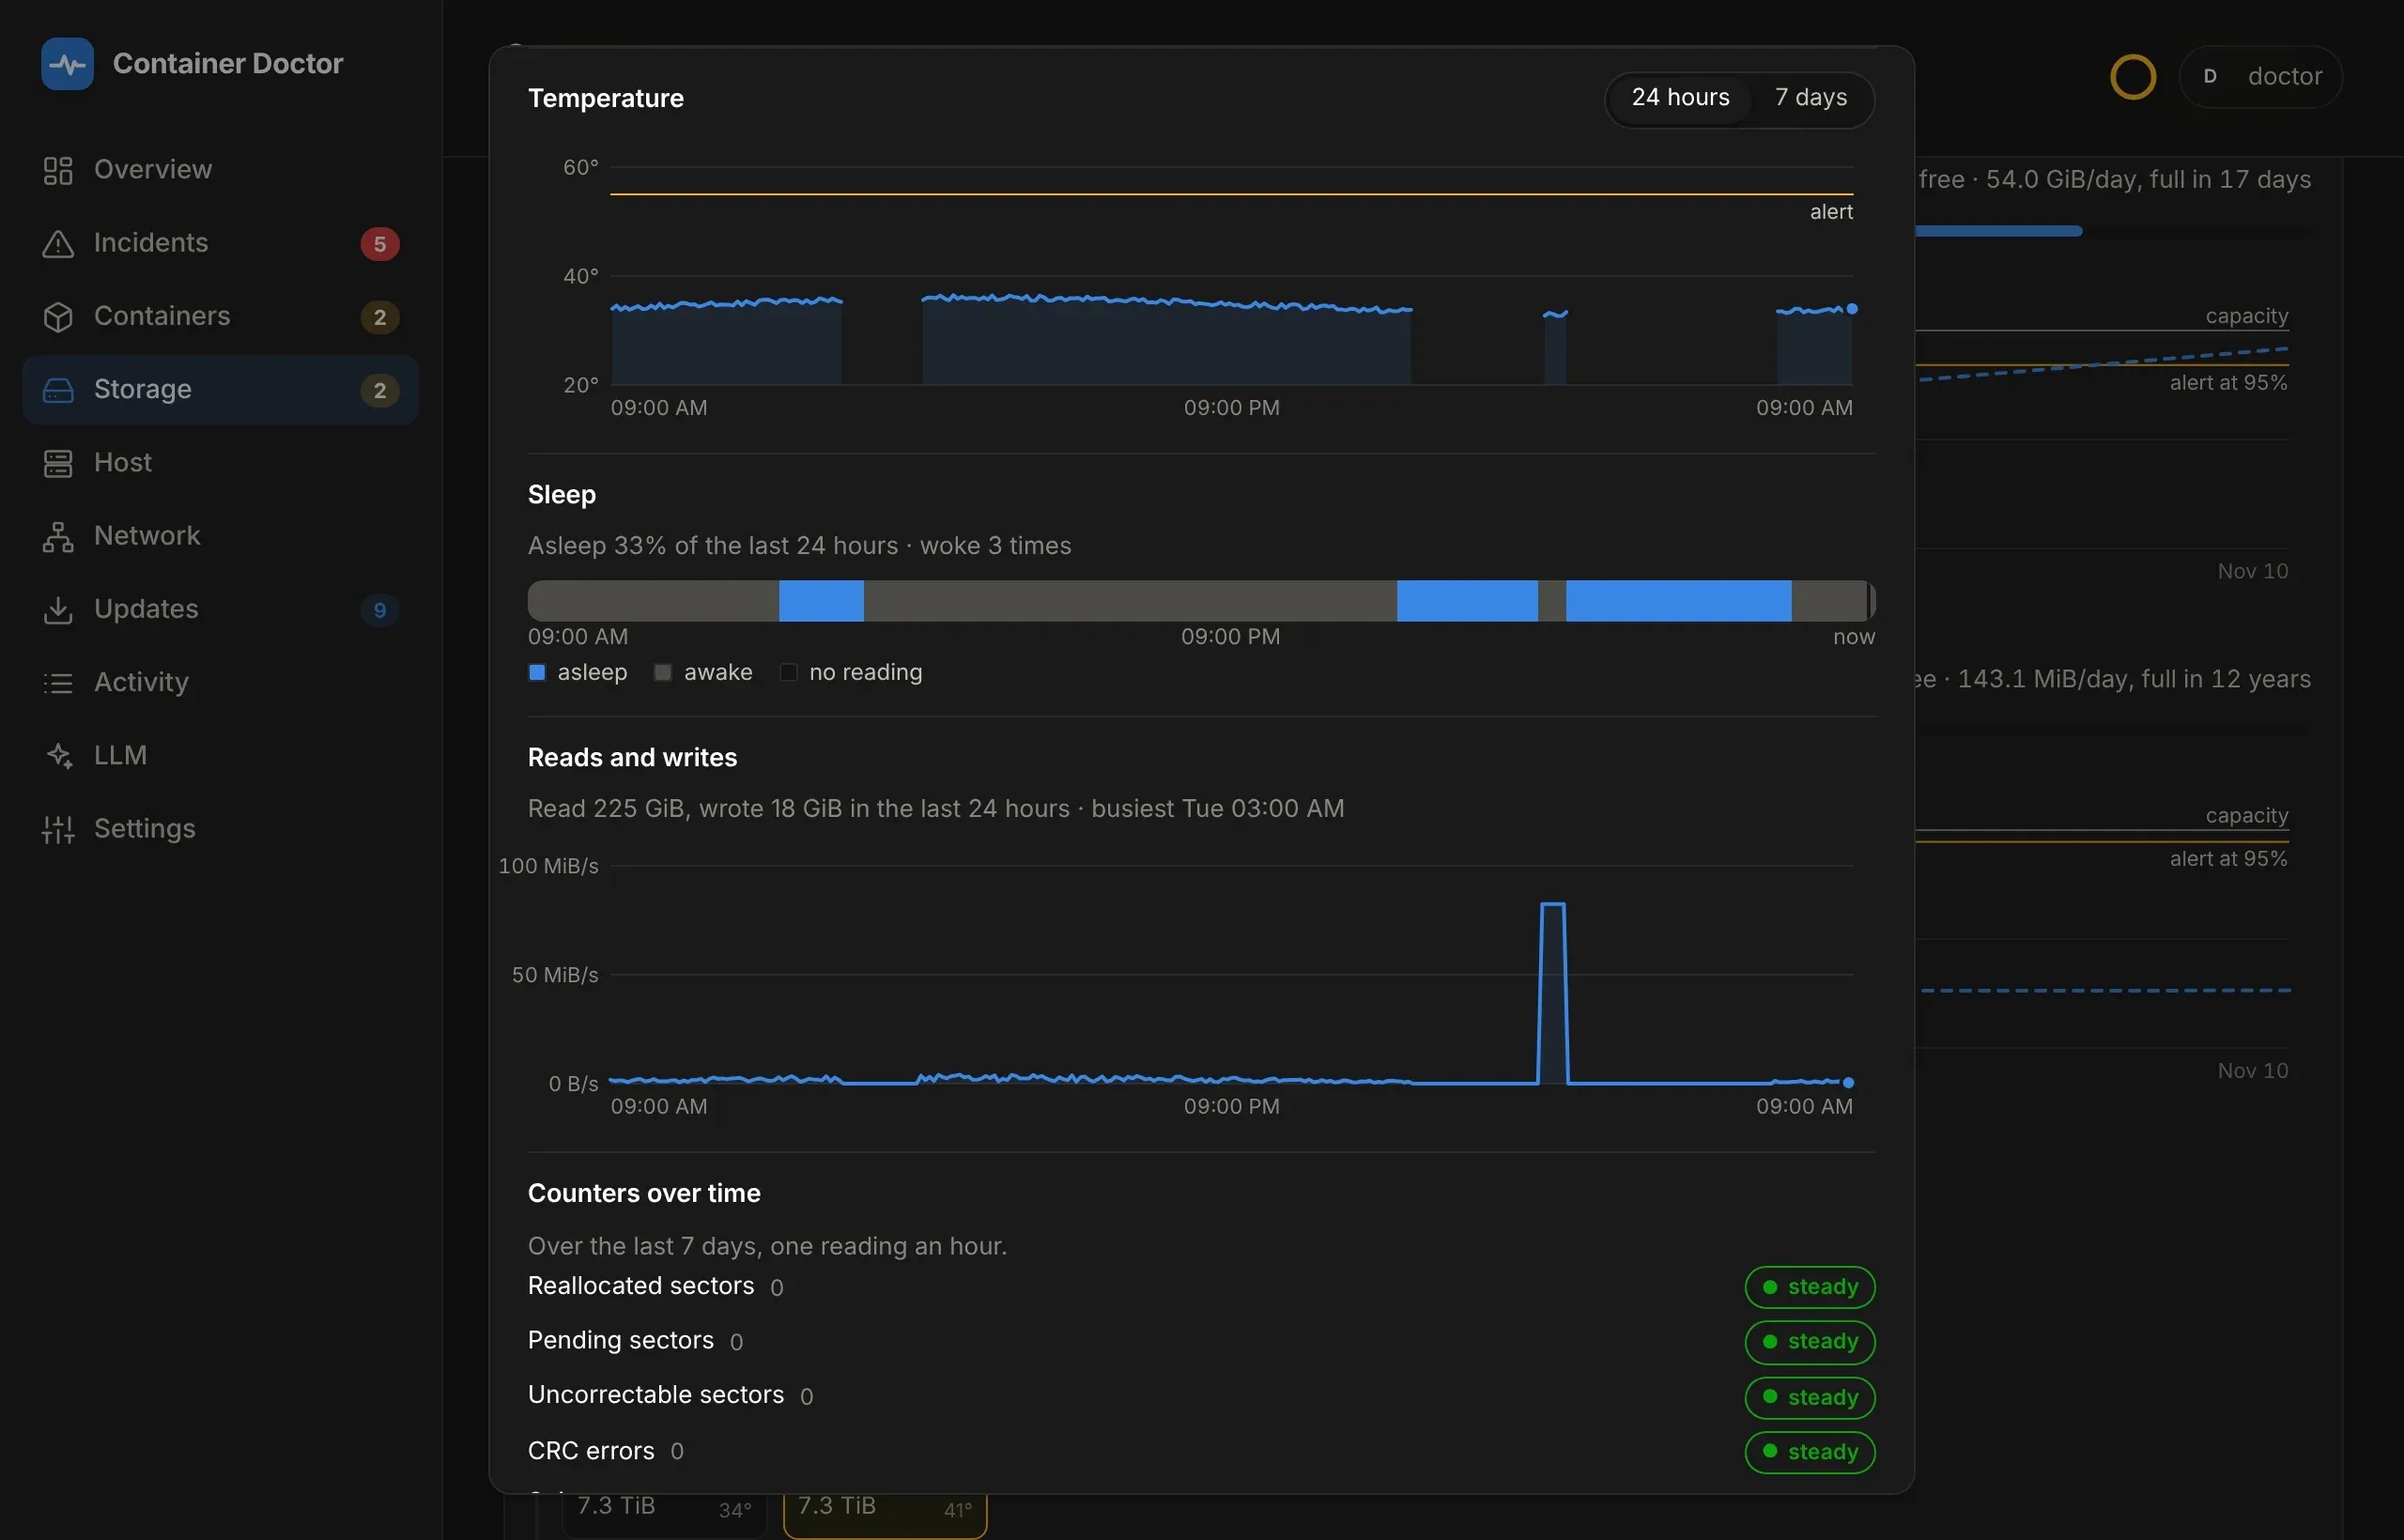
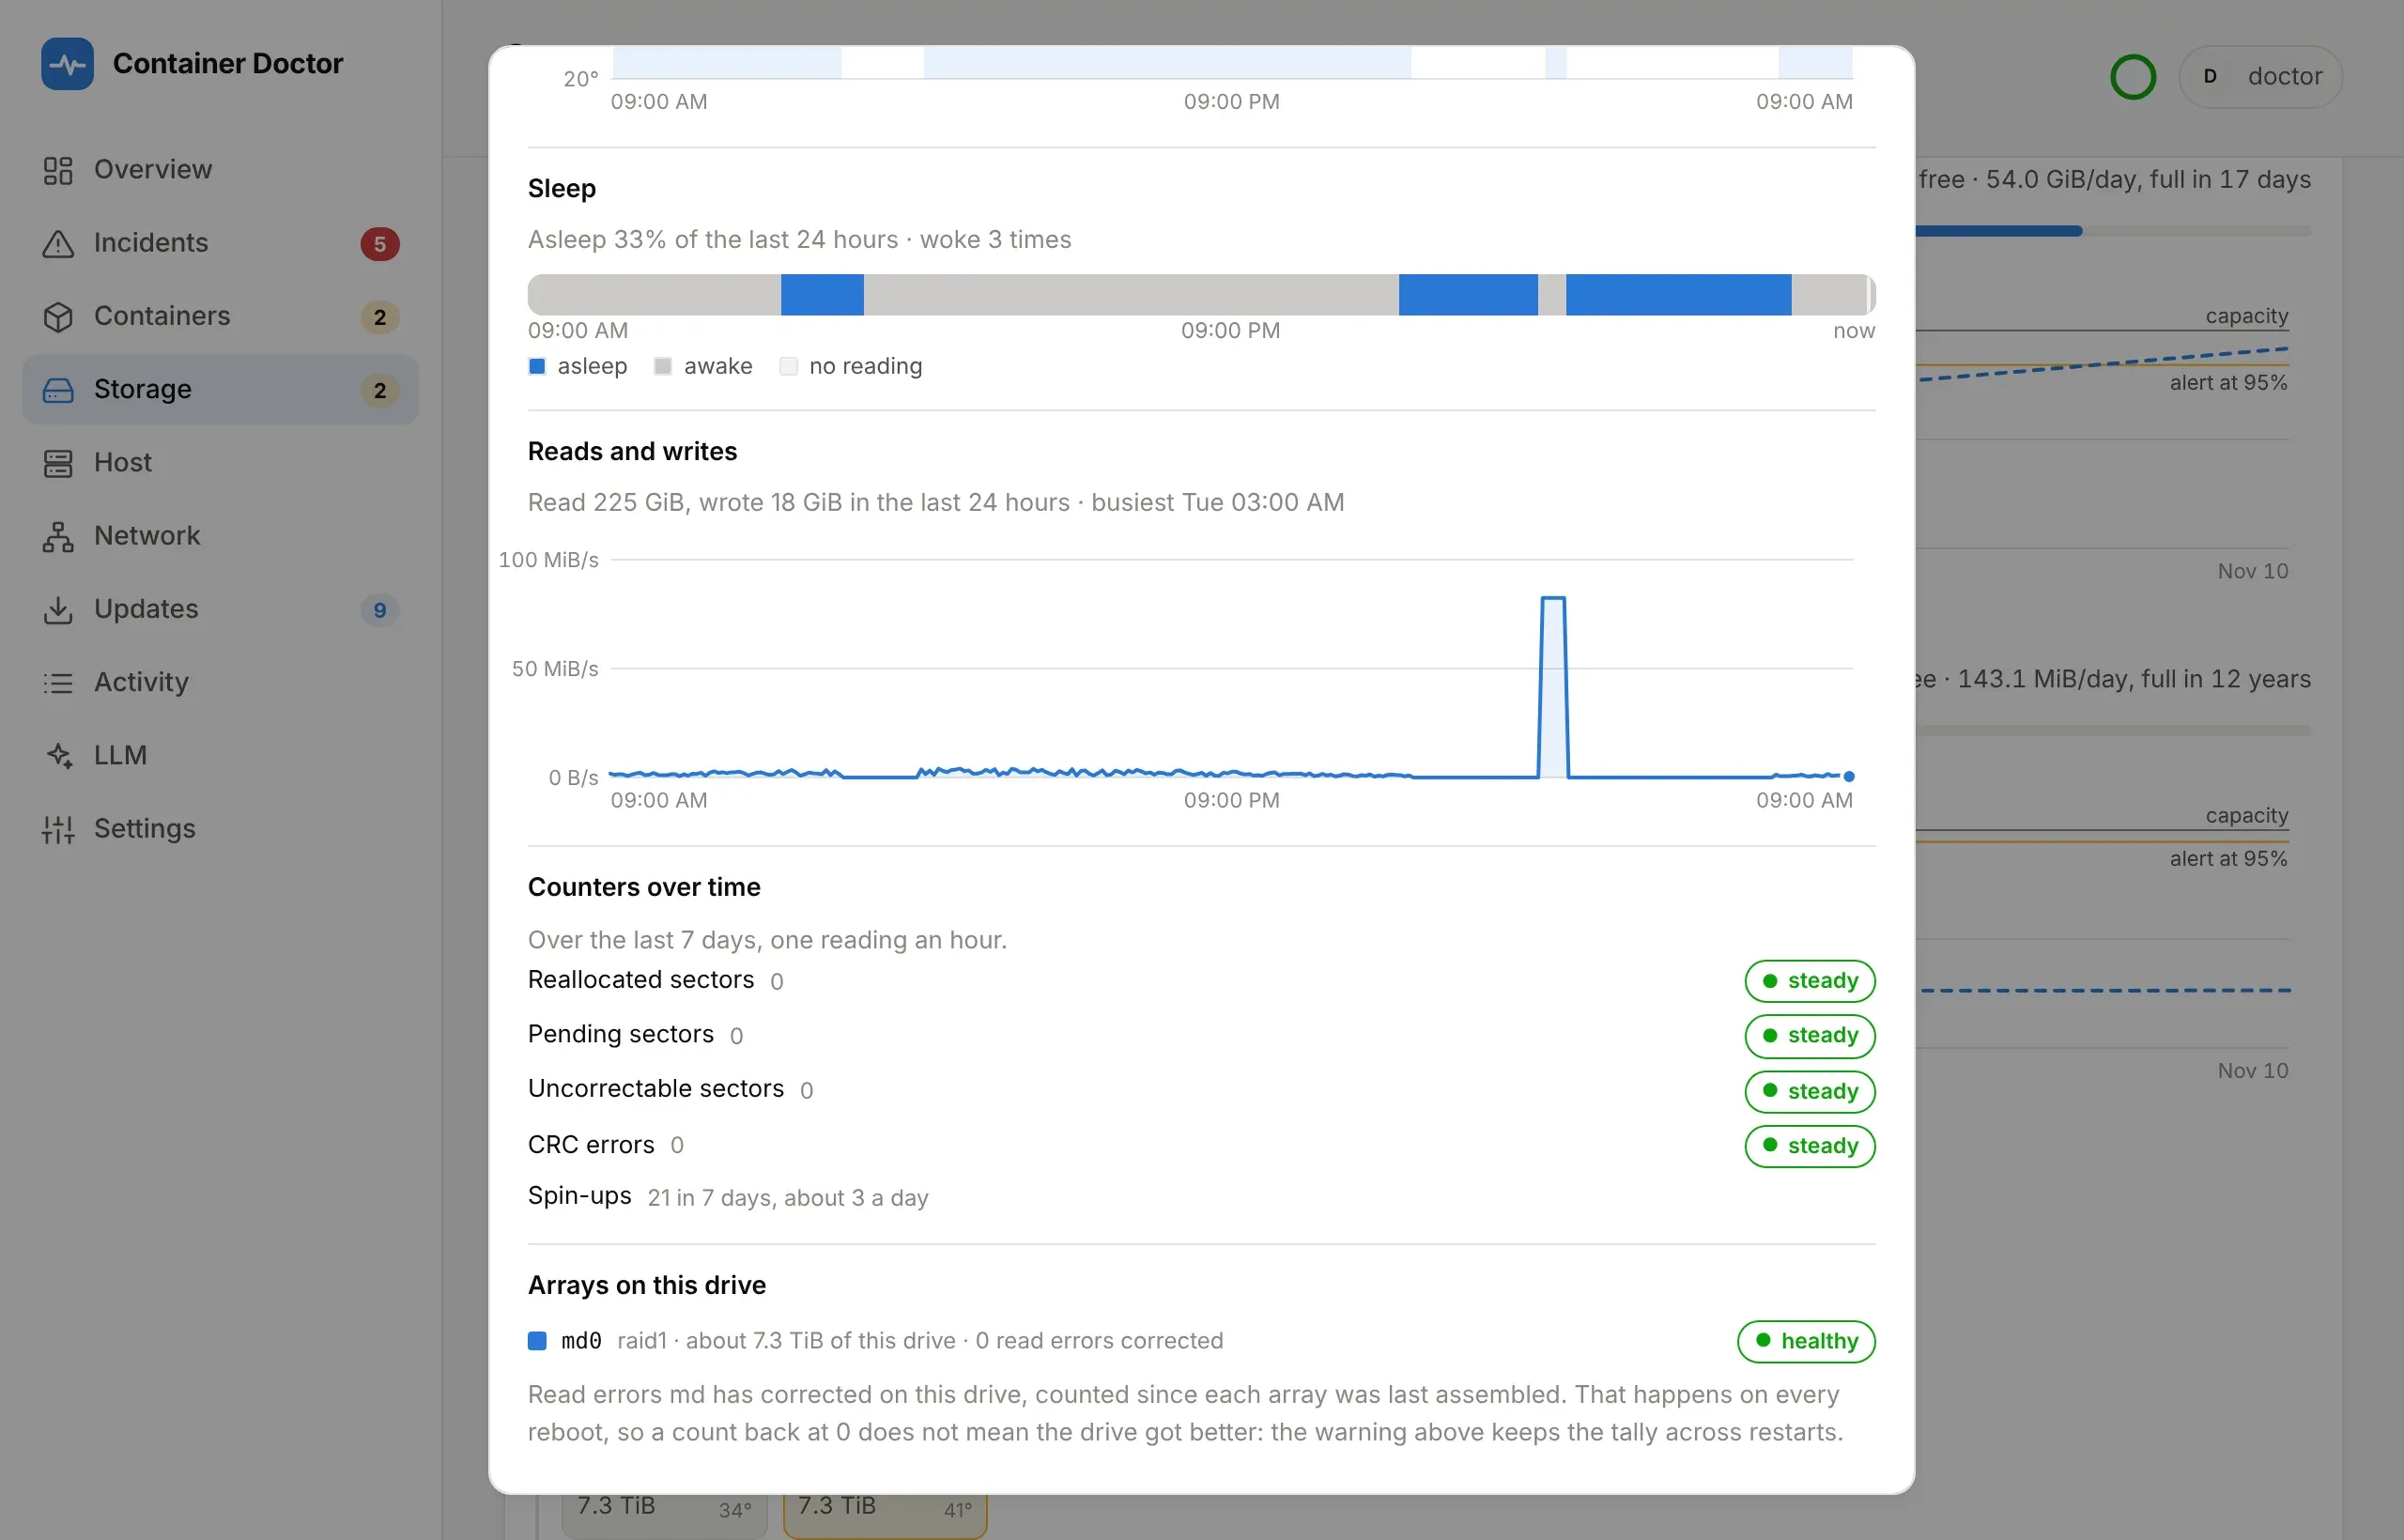
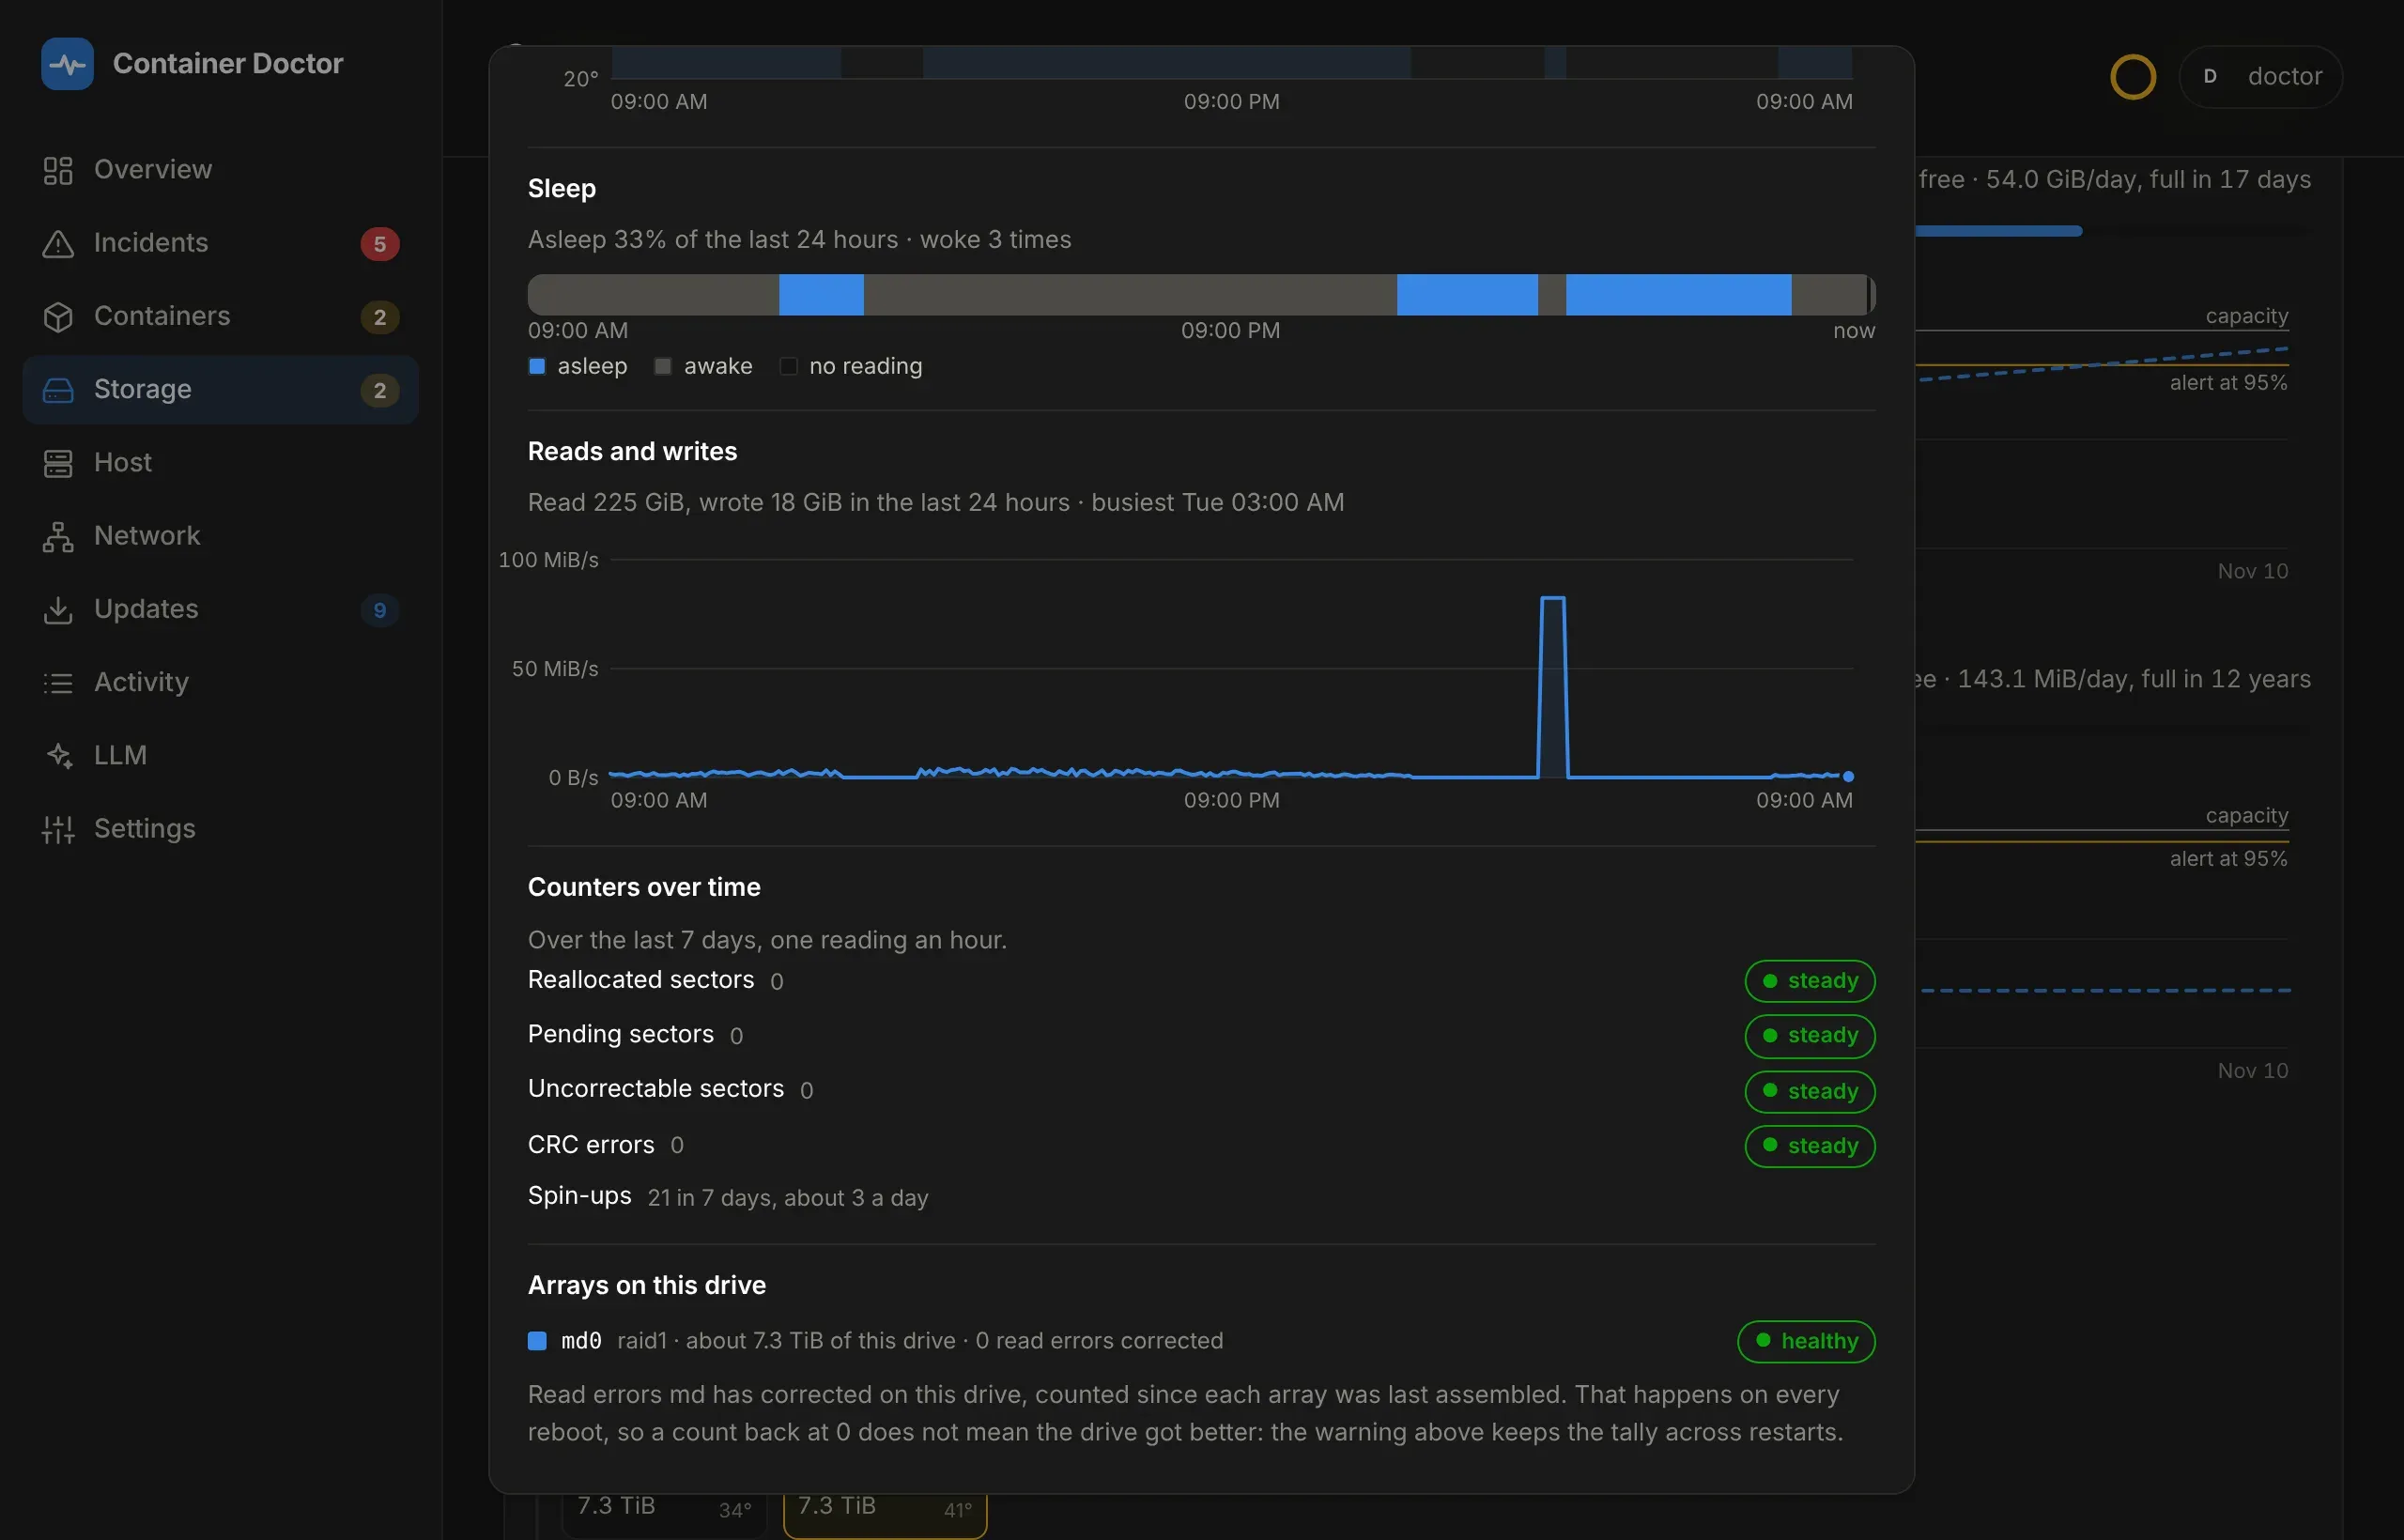
Section titled “Drive sleep”A hard disk’s page also shows whether it has been sleeping: how much of the last 24 hours or 7 days it spent in standby, how often it woke, and a bar of when. That answers “do my disks spin down at all, and what keeps waking them?” without digging through the NAS’s own logs.
It costs the drives nothing. The sidecar asks a drive whether it is in standby
before it reads anything, and asking does not spin it up - except where the
question itself wakes the drive, as in an expansion unit in deep sleep; for
those, see Cold drives. Each reading is kept
per five minutes (DOCTOR_HOST_SAMPLE_MINUTES), which catches every wake: a
drive that wakes stays up for at least the NAS’s idle timeout, 10 minutes or
more on Synology. A wake is counted only when the drive was seen asleep and
then awake in the next slot, so a gap in the readings - the doctor down - is
never one. The bar shows when, not why: what woke a disk is the NAS’s to say.
On Synology, Support Center’s hibernation debugging mode names the process.
Asleep, a drive tells smartctl nothing about itself, not even its serial. The doctor remembers each drive from its last reading awake - across restarts too - so a sleeping drive keeps its name and model on the Storage page and its history stays filed under its serial. SSDs and NVMe drives never spin down and have no sleep section.
Cold drives
Section titled “Cold drives”Some drives wake for the question itself. A Synology expansion unit with Deep Sleep on (Control Panel → Hardware & Power → Drive Hibernation) powers down as a whole, and answering “are you asleep?” powers it back up - so a reading every five minutes keeps waking it, and Log Center fills with Disks in Expansion Unit woke up from hibernation every 20-odd minutes. Stopping the sidecar for an hour tells whether it is the cause.
List such drives as cold, and a second reader in the sidecar reads them only once a day; the everyday reader leaves them alone:
DOCTOR_SMART_COLD_DEVICES=/dev/sata5,/dev/sata6DOCTOR_SMART_COLD_HOURS=24DOCTOR_SMART_COLD_HOURS sets how often - 6 for four readings a day, 168 for
one a week. Both the sidecar and the doctor read these two, so set them in the
stack environment, not in one service. The second reader listens on port 9634
on the doctor’s internal network only (DOCTOR_SMART_COLD_URL).
A cold drive keeps everything SMART says about it - health, counters, wear, temperature - just less often: its row on the Storage page says cold, read once a day, and its page says when its latest values came. It is not asked whether it sleeps, so it has no sleep bar. Its reading stays the same for the whole interval, so the doctor records it only when the values change: a day-old temperature is not charted as the current one, every minute, all day. A problem it reports still opens an incident as soon as it is read.
Reads and writes
Section titled “Reads and writes”Each drive’s page charts its reads and writes over the same range, with how
much it read and wrote in total and when it was busiest. They come from the
kernel’s own counters (/proc/diskstats), so this works without the SMART
sidecar too. Beside the sleep bar it shows what the bar cannot: a disk that
wakes at 3:00 every night and reads for half an hour is a backup or a scan,
not a stray process. The Host page shows the same counters live; this is
their history, averaged per five minutes (DOCTOR_HOST_SAMPLE_MINUTES).
Counters over time
Section titled “Counters over time”SMART counters only ever say where a drive stands: 24 reallocated sectors reads the same whether they were remapped three years ago or this morning. The doctor keeps one reading an hour of each drive’s counters - reallocated, pending and uncorrectable sectors, CRC errors, an NVMe drive’s media errors, and a hard disk’s spin-ups - and the drive’s page says, for the last 30 days, which stayed steady and which rose, how often, and when last. Pending sectors that went back to 0 were remapped or rewritten, and the rise is still shown. Spin-ups come with a rate: a disk spinning up dozens of times a day wears faster than one that stays up.
The history is kept for DOCTOR_RETENTION_DAYS, like the rest.
When a disk drops out of the array
Section titled “When a disk drops out of the array”A degraded array is the failure on a storage host that loses data, and it is invisible to everything else the doctor watches: every container runs on one disk exactly as it did on two, right up to the moment the second one goes too.
Linux software RAID is md arrays - and so is every DSM volume, SHR included -
and the kernel reports their state in /proc/mdstat. That file is readable from inside the
container with no mount and no privilege — md state is kernel-wide rather
than per namespace, so a container sees the host’s arrays — and the doctor reads
it on every poll.
| What it sees | Incident |
|---|---|
A member marked (F) |
critical — the kernel has failed that disk out |
[2/1] [U_] on a data array |
critical — a disk is missing |
recovery or reshape running |
warning, with progress and time left — a replacement is going in, but it is one failure from data loss until done |
check (a scrub) or a resync with every disk present |
nothing — shown in the panel, routine |
The awkward part, on a Synology, is md0 and md1, DSM’s system and swap
arrays. DSM sizes
them for every bay the model could have, so a two-disk four-bay unit shows
[4/2] [UU__] there forever. For those the doctor remembers the most disks it
has seen each array with — in SQLite, so a disk lost while the doctor was down
does not quietly become the new normal — and only a drop below that counts.
This applies only on a Synology (detected, or DOCTOR_HOST_KIND=synology): on
any other host md0 is an ordinary array, often the data one, and an empty slot
there is degraded like anywhere else.
The incident closes itself the poll the array is whole again, with a
notification saying so. The doctor never acts on one: whatever the diagnosis
proposes, it is recorded as notify-only, because a restart cannot bring a disk
back and a prune only adds load to the disks that are left. DOCTOR_MDSTAT_PATH
points elsewhere or, set to off, turns the check off; a host without software
RAID (or a Synology with a single Basic volume) has no arrays and the panel says
so once.
Pools, layers and SSD caches
Section titled “Pools, layers and SSD caches”Each storage pool is drawn as its drives, its volumes and the arrays under them, and the doctor tells three kinds of array apart:
- SHR layers. Several arrays under one volume, each a layer of the pool (below).
- A single RAID. One array, its volumes on top: two SSDs in RAID 1 with a volume that takes only part of them, say. The pool shows how much of it is not in a volume yet.
- An SSD cache. An array that reaches a volume through DSM’s cache device
(
cachedev_N) by way of a cache volume group of its own, not through the volume itself. It speeds the volume up but holds none of its data, so it is shown in its own colour, as SSD cache for Volume 2, and is no layer.
Every volume says its filesystem - Btrfs, ext4, XFS - read from /sys/fs,
which lists the filesystems mounted anywhere on the host, so a volume the
doctor has no mount of is named as well as its own.
Pools are named the way Storage Manager names them. DSM 7 calls a pool’s
volume group vgN after Storage Pool N. A pool made by DSM 6 has vg1000
instead, and a pool added beside it then gets vg1 although it is Storage
Pool 2, so unless every pool has a number of its own they are counted in the
order their arrays were made. DSM 6’s volume (vg1000-lv) takes the lowest
Volume N no other volume has.
Why one volume shows several arrays
Section titled “Why one volume shows several arrays”On a Synology, SHR on drives of different sizes is not one RAID. DSM cuts every drive into slices, builds a separate md array across each layer of slices, and joins them with LVM into one volume. Seven 6 TB drives and one 3 TB drive make:
| Array | What it is |
|---|---|
md2 |
raid5 across the first 3 TB of all 8 drives |
md3 |
raid5 across the rest of the 7 larger drives — the small one has nothing left |
md0, md1 |
DSM’s system and swap, raid1 on every drive |
mdstat alone cannot tell that apart from three volumes, so the doctor also reads
/sys, which Docker mounts read-only in every container. Its block devices are
the host’s, and the files are world-readable, so this needs no mount and no
privilege either:
| From | Shown as |
|---|---|
/sys/block/mdN/holders, …/slaves, …/dm/name |
the arrays grouped under the volume they make up (vg1-volume_1 → Volume 1, layer 1 of 2), with the watched path on it, found through /proc/self/mountinfo |
/sys/block/sataN/size, …/device/model |
the drive bay, size and model behind each member |
/sys/fs/btrfs/*/devices, /sys/fs/ext4, /sys/fs/xfs |
each volume’s filesystem |
/sys/block/mdN/md/mismatch_cnt after a check |
a raid_errors warning if the last scrub found sectors that disagree — not on md0/md1, where swap on RAID 1 has them as a matter of course |
/sys/block/mdN/md/dev-*/errors |
a raid_errors warning naming the drive when md has had to correct read errors from it — often the first sign of a failing disk, and one the array never reports as degraded |
Read errors belong to a drive, not an array. On SHR a drive is in every layer it has room for, so its counts are added up across md2, md3, … into one warning and one incident: Drive 7 has had 40 read errors corrected (32 in md2, 8 in md3).
- Any newly corrected error is a warning. A healthy disk has none. md already
tolerates them: it rewrites the sector from parity, and fails the disk only
past
max_corr_read_errors(20, halved every hour). A second, looser limit would only hide what md is quietly absorbing. - Errors that keep coming are critical.
DOCTOR_RAID_ERRORS_PER_DAY(default 10,0never escalates) new errors within 24 hours opens a critical incident in place of the warning. Errors a disk already had when the doctor first saw it are not counted as new. - Errors that stopped are history. md’s count only goes back to 0 when
the arrays are assembled - a reboot - so it cannot be what clears a
warning. The doctor keeps an hourly reading per drive and warns only while
the count has grown in the last
DOCTOR_RAID_ERRORS_DAYS(default 7): Drive 7 has had 8 read errors corrected in the last 7 days, 48 since its arrays were last assembled. A drive first seen with errors warns for one such window, since the doctor cannot tell how old they are. - A reboot does not forget them. Errors before a reboot still count towards the window, so the warning does not go quiet just because md started again from 0.
- An unchanged count is not a new sighting. The incident stays open while
the warning holds, but seen N× only counts polls where the number rose. It
resolves on its own once the drive has gone
DOCTOR_RAID_ERRORS_DAYSwithout a new error, or once a scrub that found mismatches is followed by a clean one. Readings are kept forDOCTOR_RETENTION_DAYS, so a window longer than that never sees a quiet stretch.
Like raid_degraded, these are never acted on. DOCTOR_SYSFS_PATH (default
/sys) points elsewhere or, set to off, skips all of it; the panel then shows what
mdstat says. SMART data comes from the sidecar instead; see
Drive health.