The host
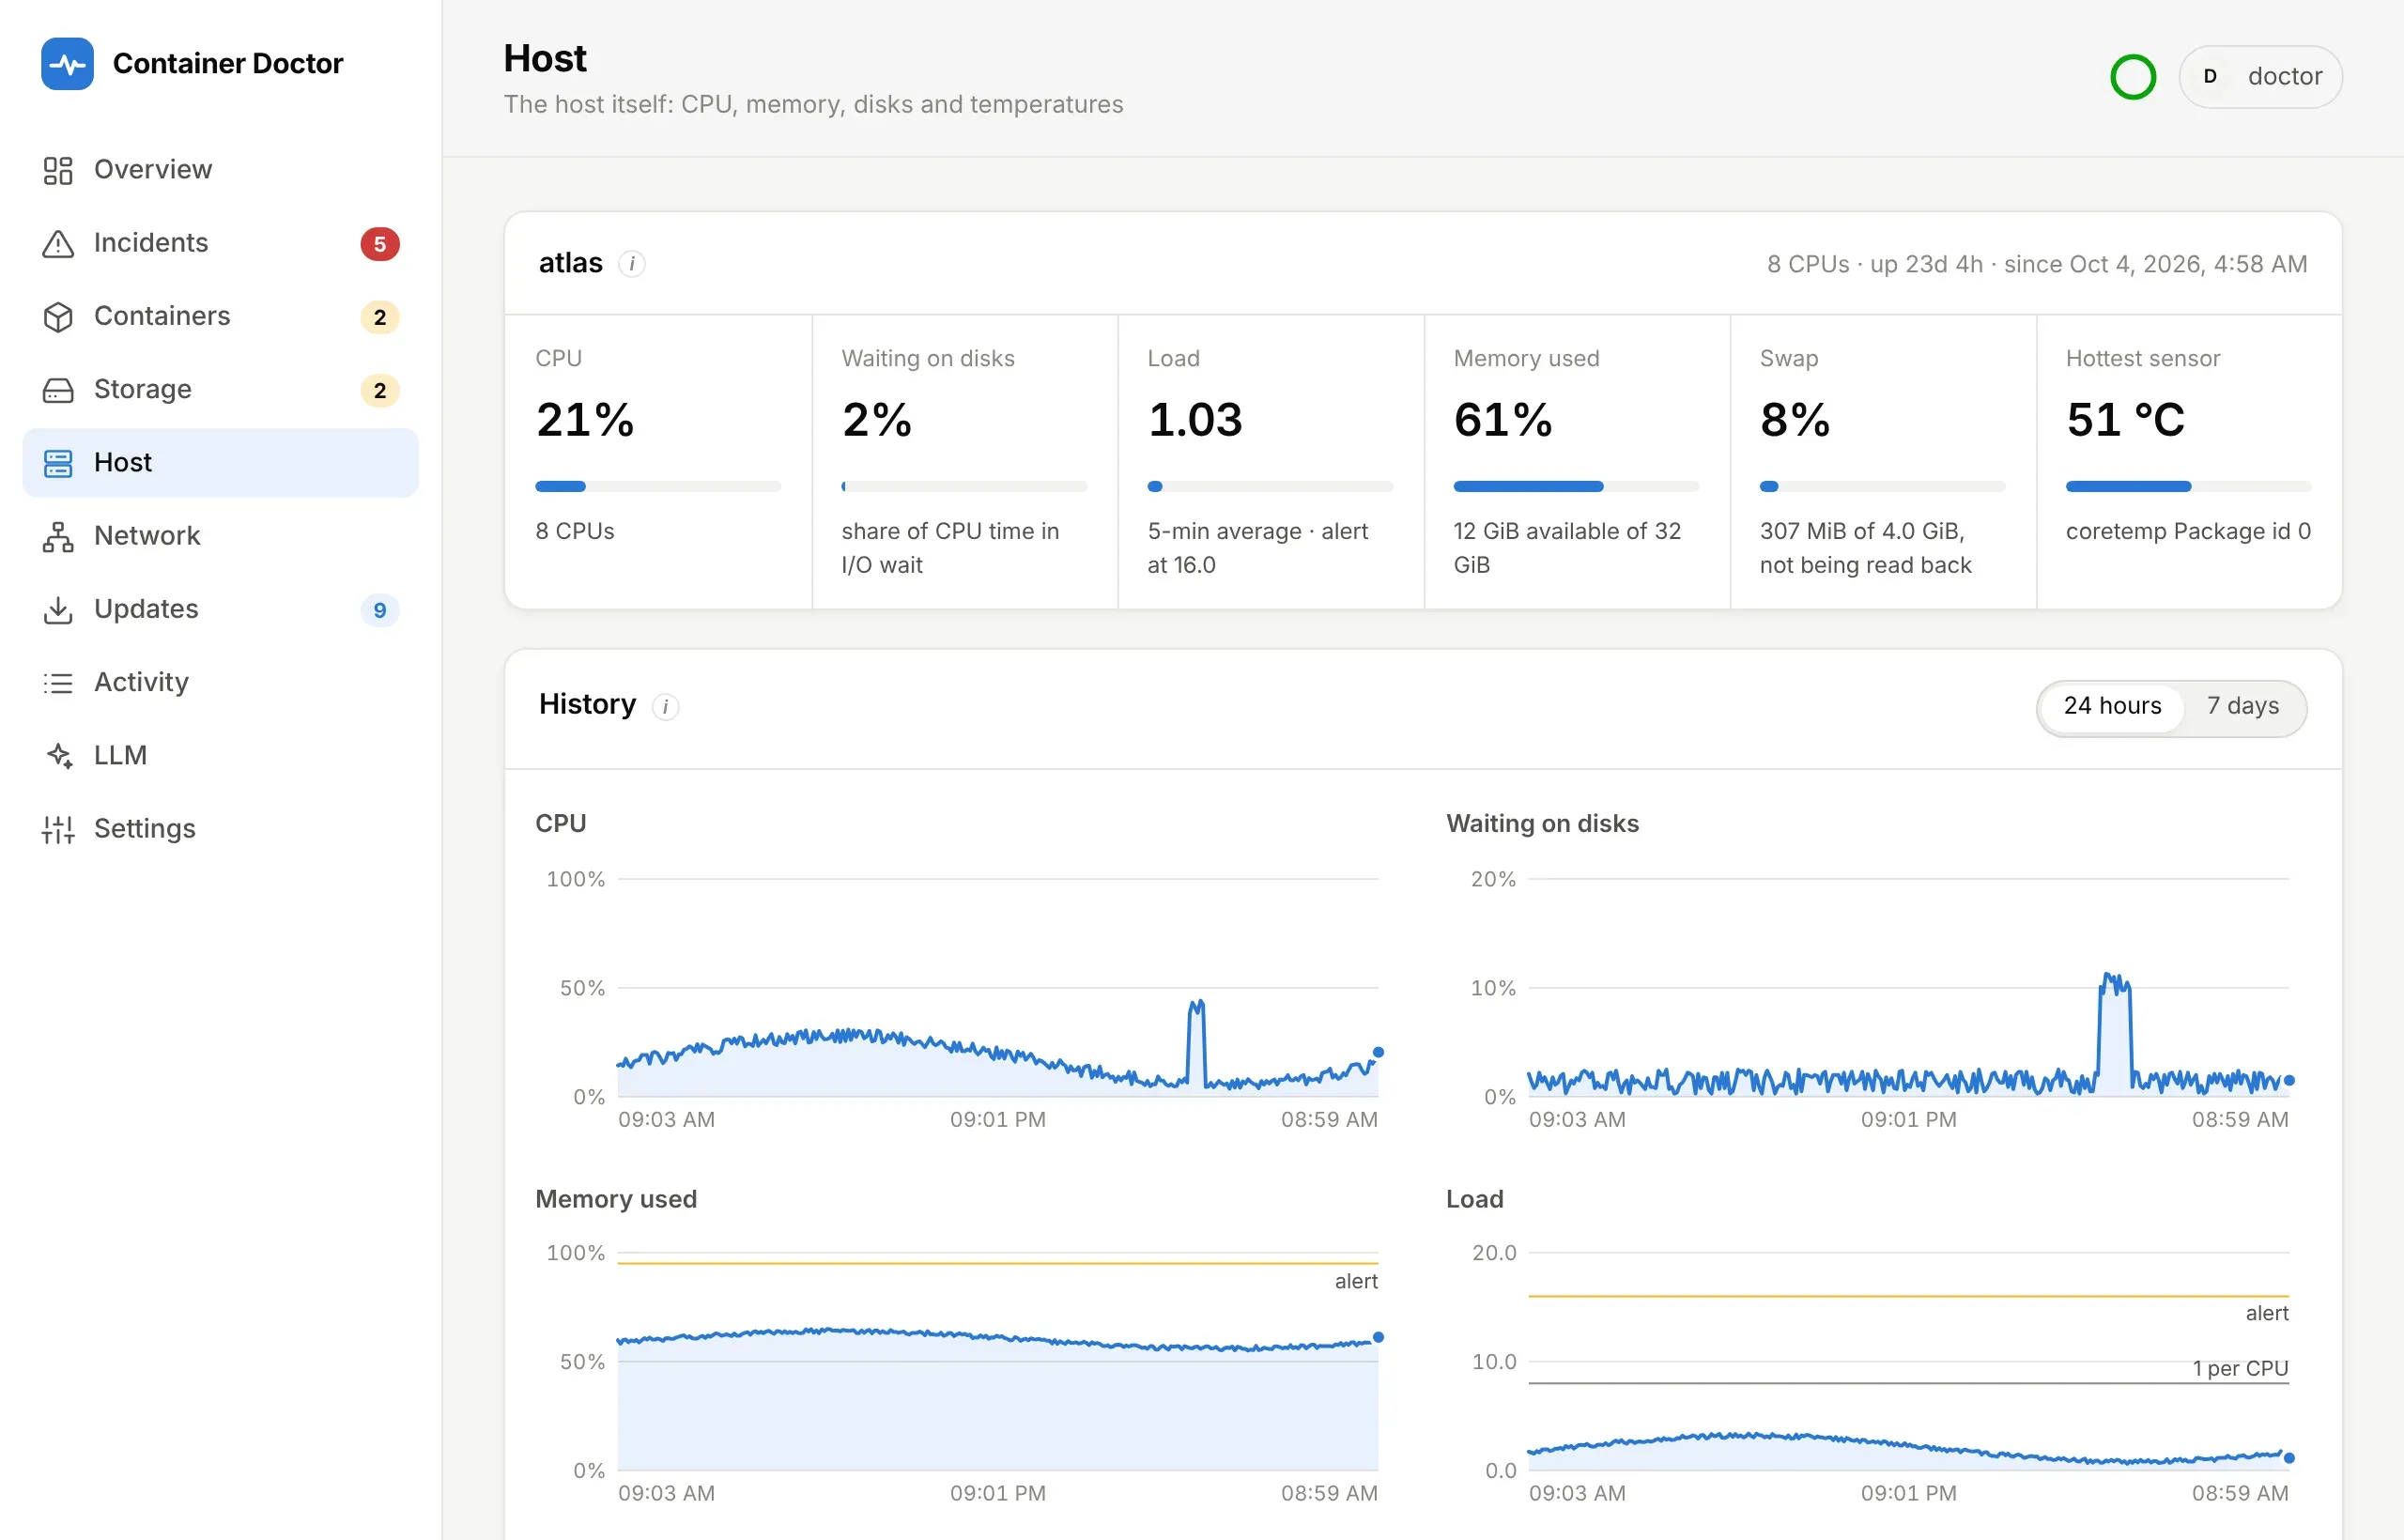
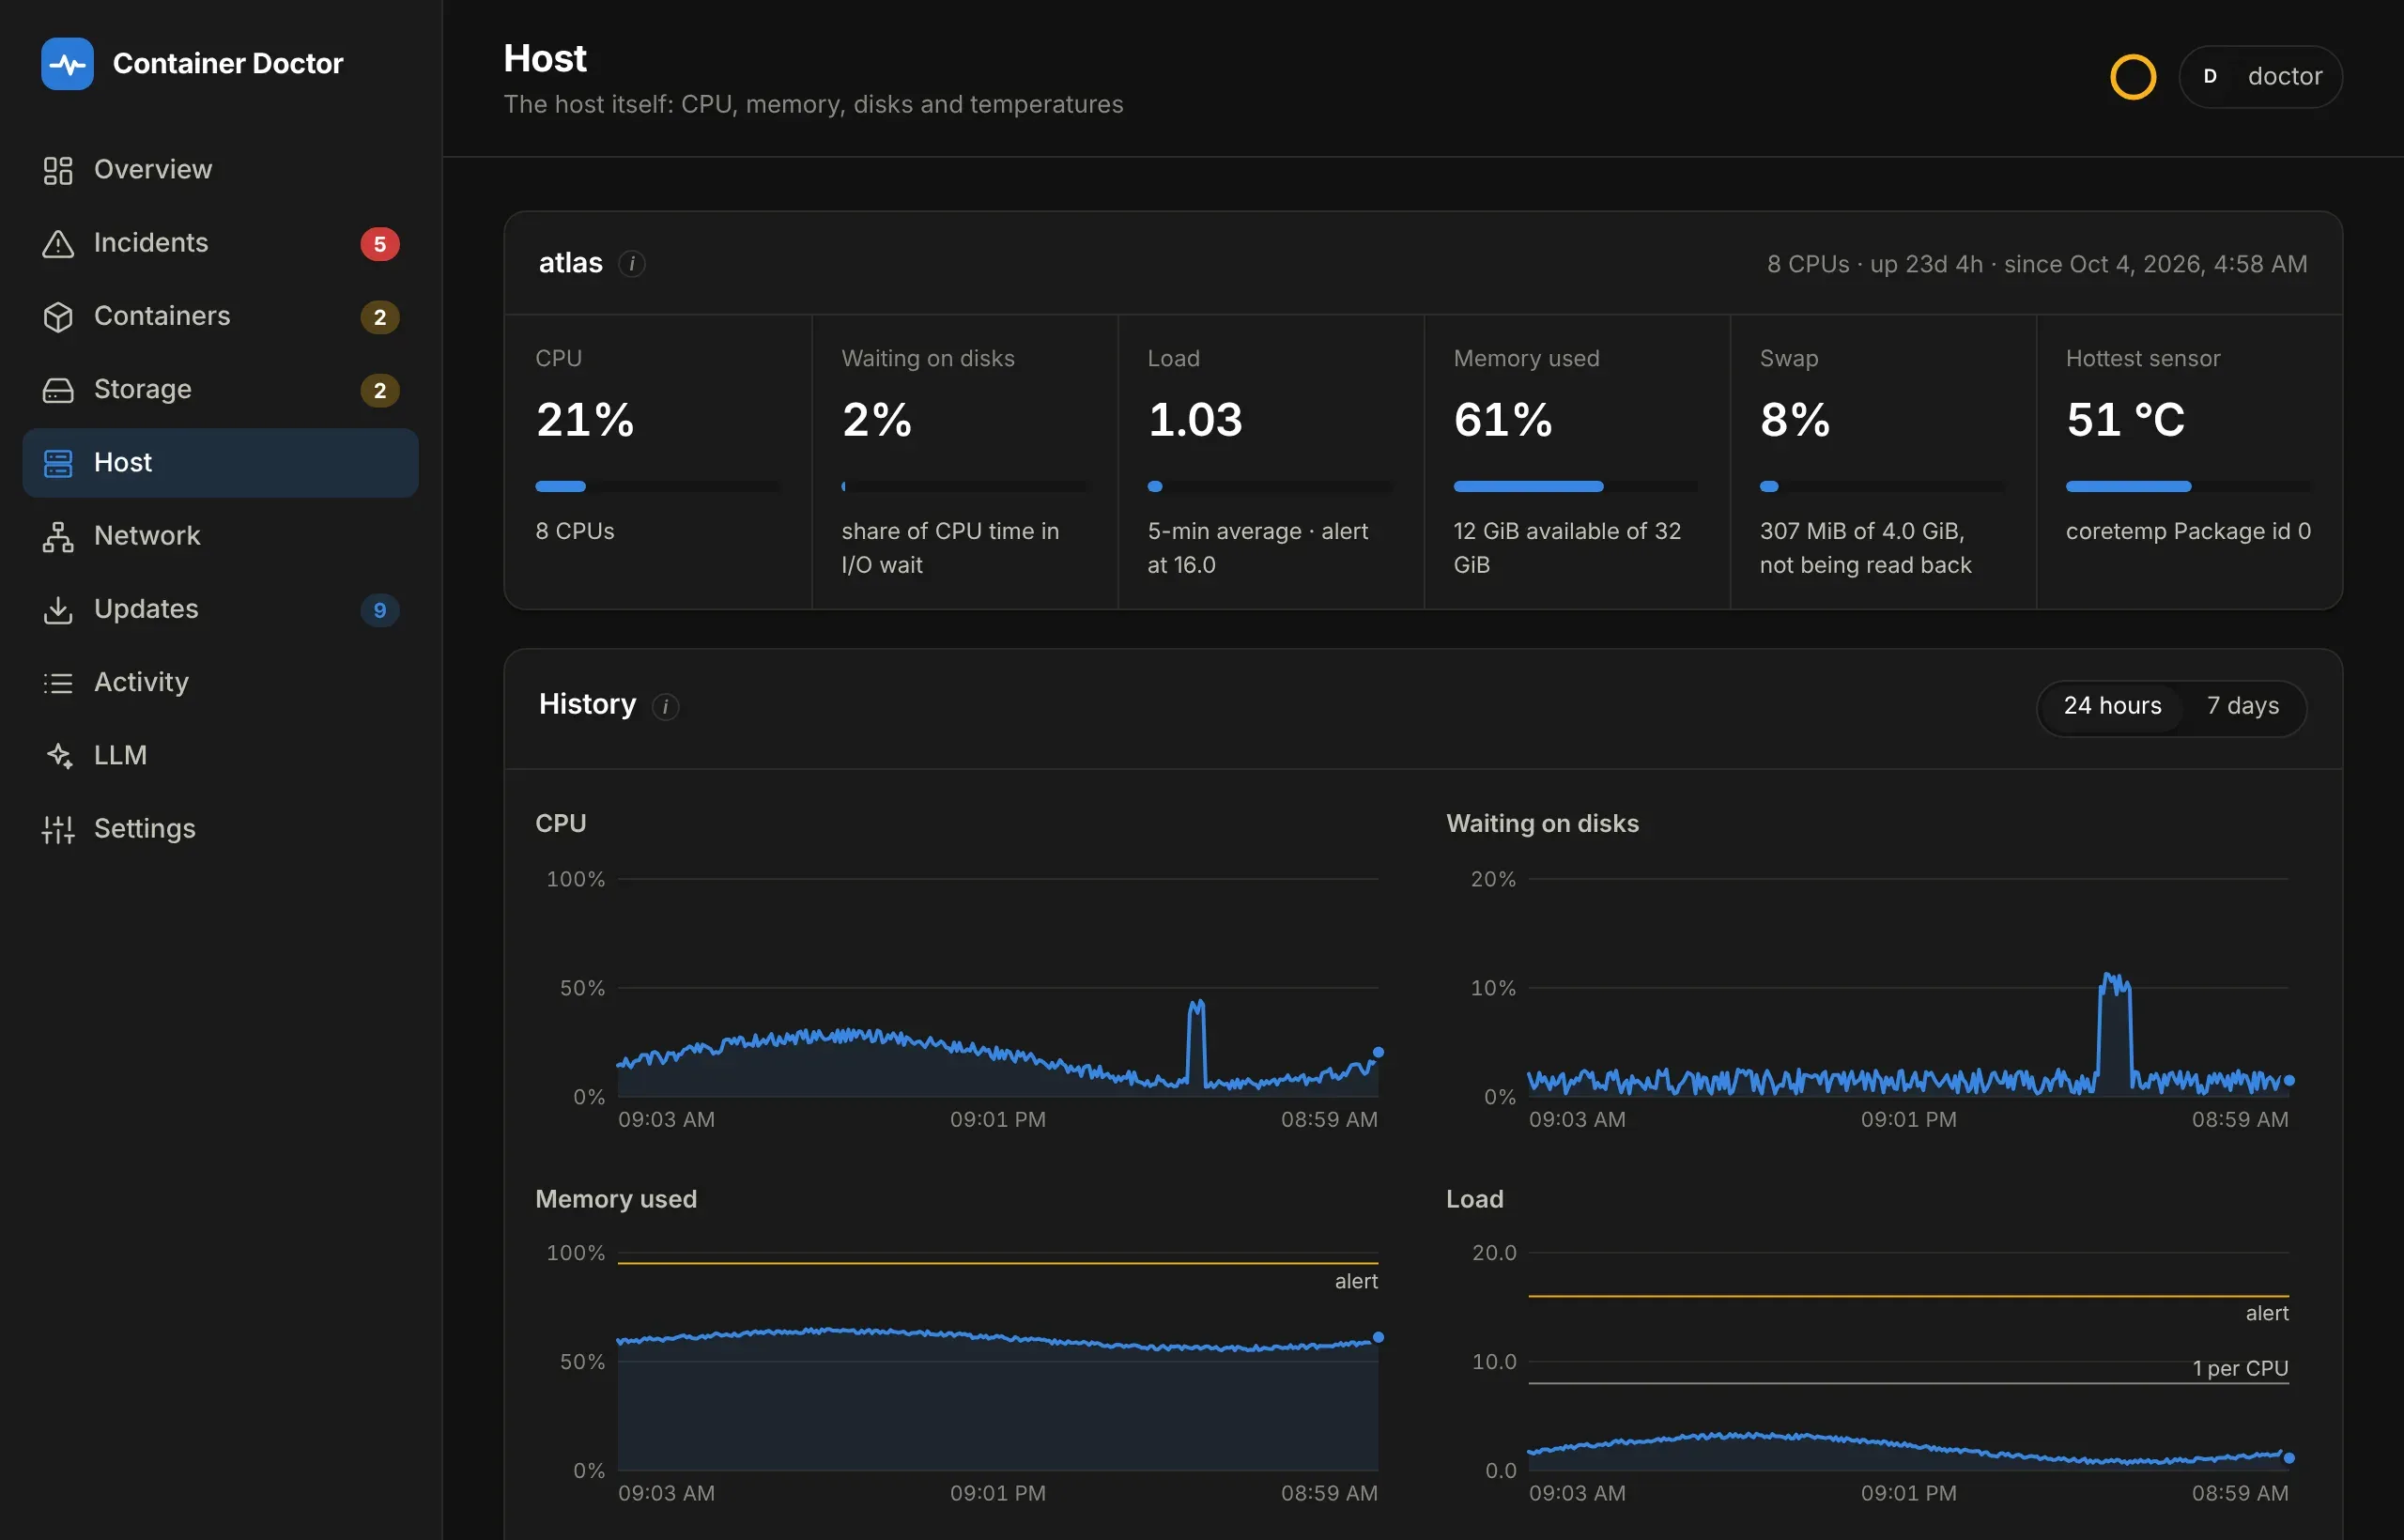
Host shows the host as a whole: CPU, I/O wait, load, memory, swap, each
disk’s activity, the kernel’s pressure figures and temperature sensors, with
charts over 24 hours or 7 days - the hottest sensor among them. It needs no extra access. /proc/stat,
/proc/meminfo, /proc/loadavg, /proc/uptime, /proc/vmstat and
/proc/diskstats are system-wide, so the doctor reads the host’s numbers from
inside its own container, the same way it already reads /proc/mdstat.
Temperatures come from /sys/class/hwmon and /sys/class/thermal, which
Docker already mounts read-only.
- Restarts. The boot time is stored, so a restart of the host, which restarts the doctor too, is still noticed. It is notified once, listed on the Host page and under Activity.
- Diagnoses. Every diagnosis is told what state the host was in. A container OOM-killed on a host with memory to spare hit its own limit; on a host out of memory, it was a victim. Host incidents also get the heaviest containers by CPU and memory.
- Missing pieces. Pressure stall information and temperatures depend on the kernel and the model. When the host does not provide them, the page says so rather than showing zeros. Pressure arrived in Linux 4.20 and DSM 7 runs 4.4 on most models, so on a Synology it is usually absent; the page names the kernel it found. Network traffic is not here: a container only sees its own interfaces. Drive health is on the Storage page; see Drive health.
DOCTOR_PROC_PATH=off turns the page and its rules off.
Who used the CPU
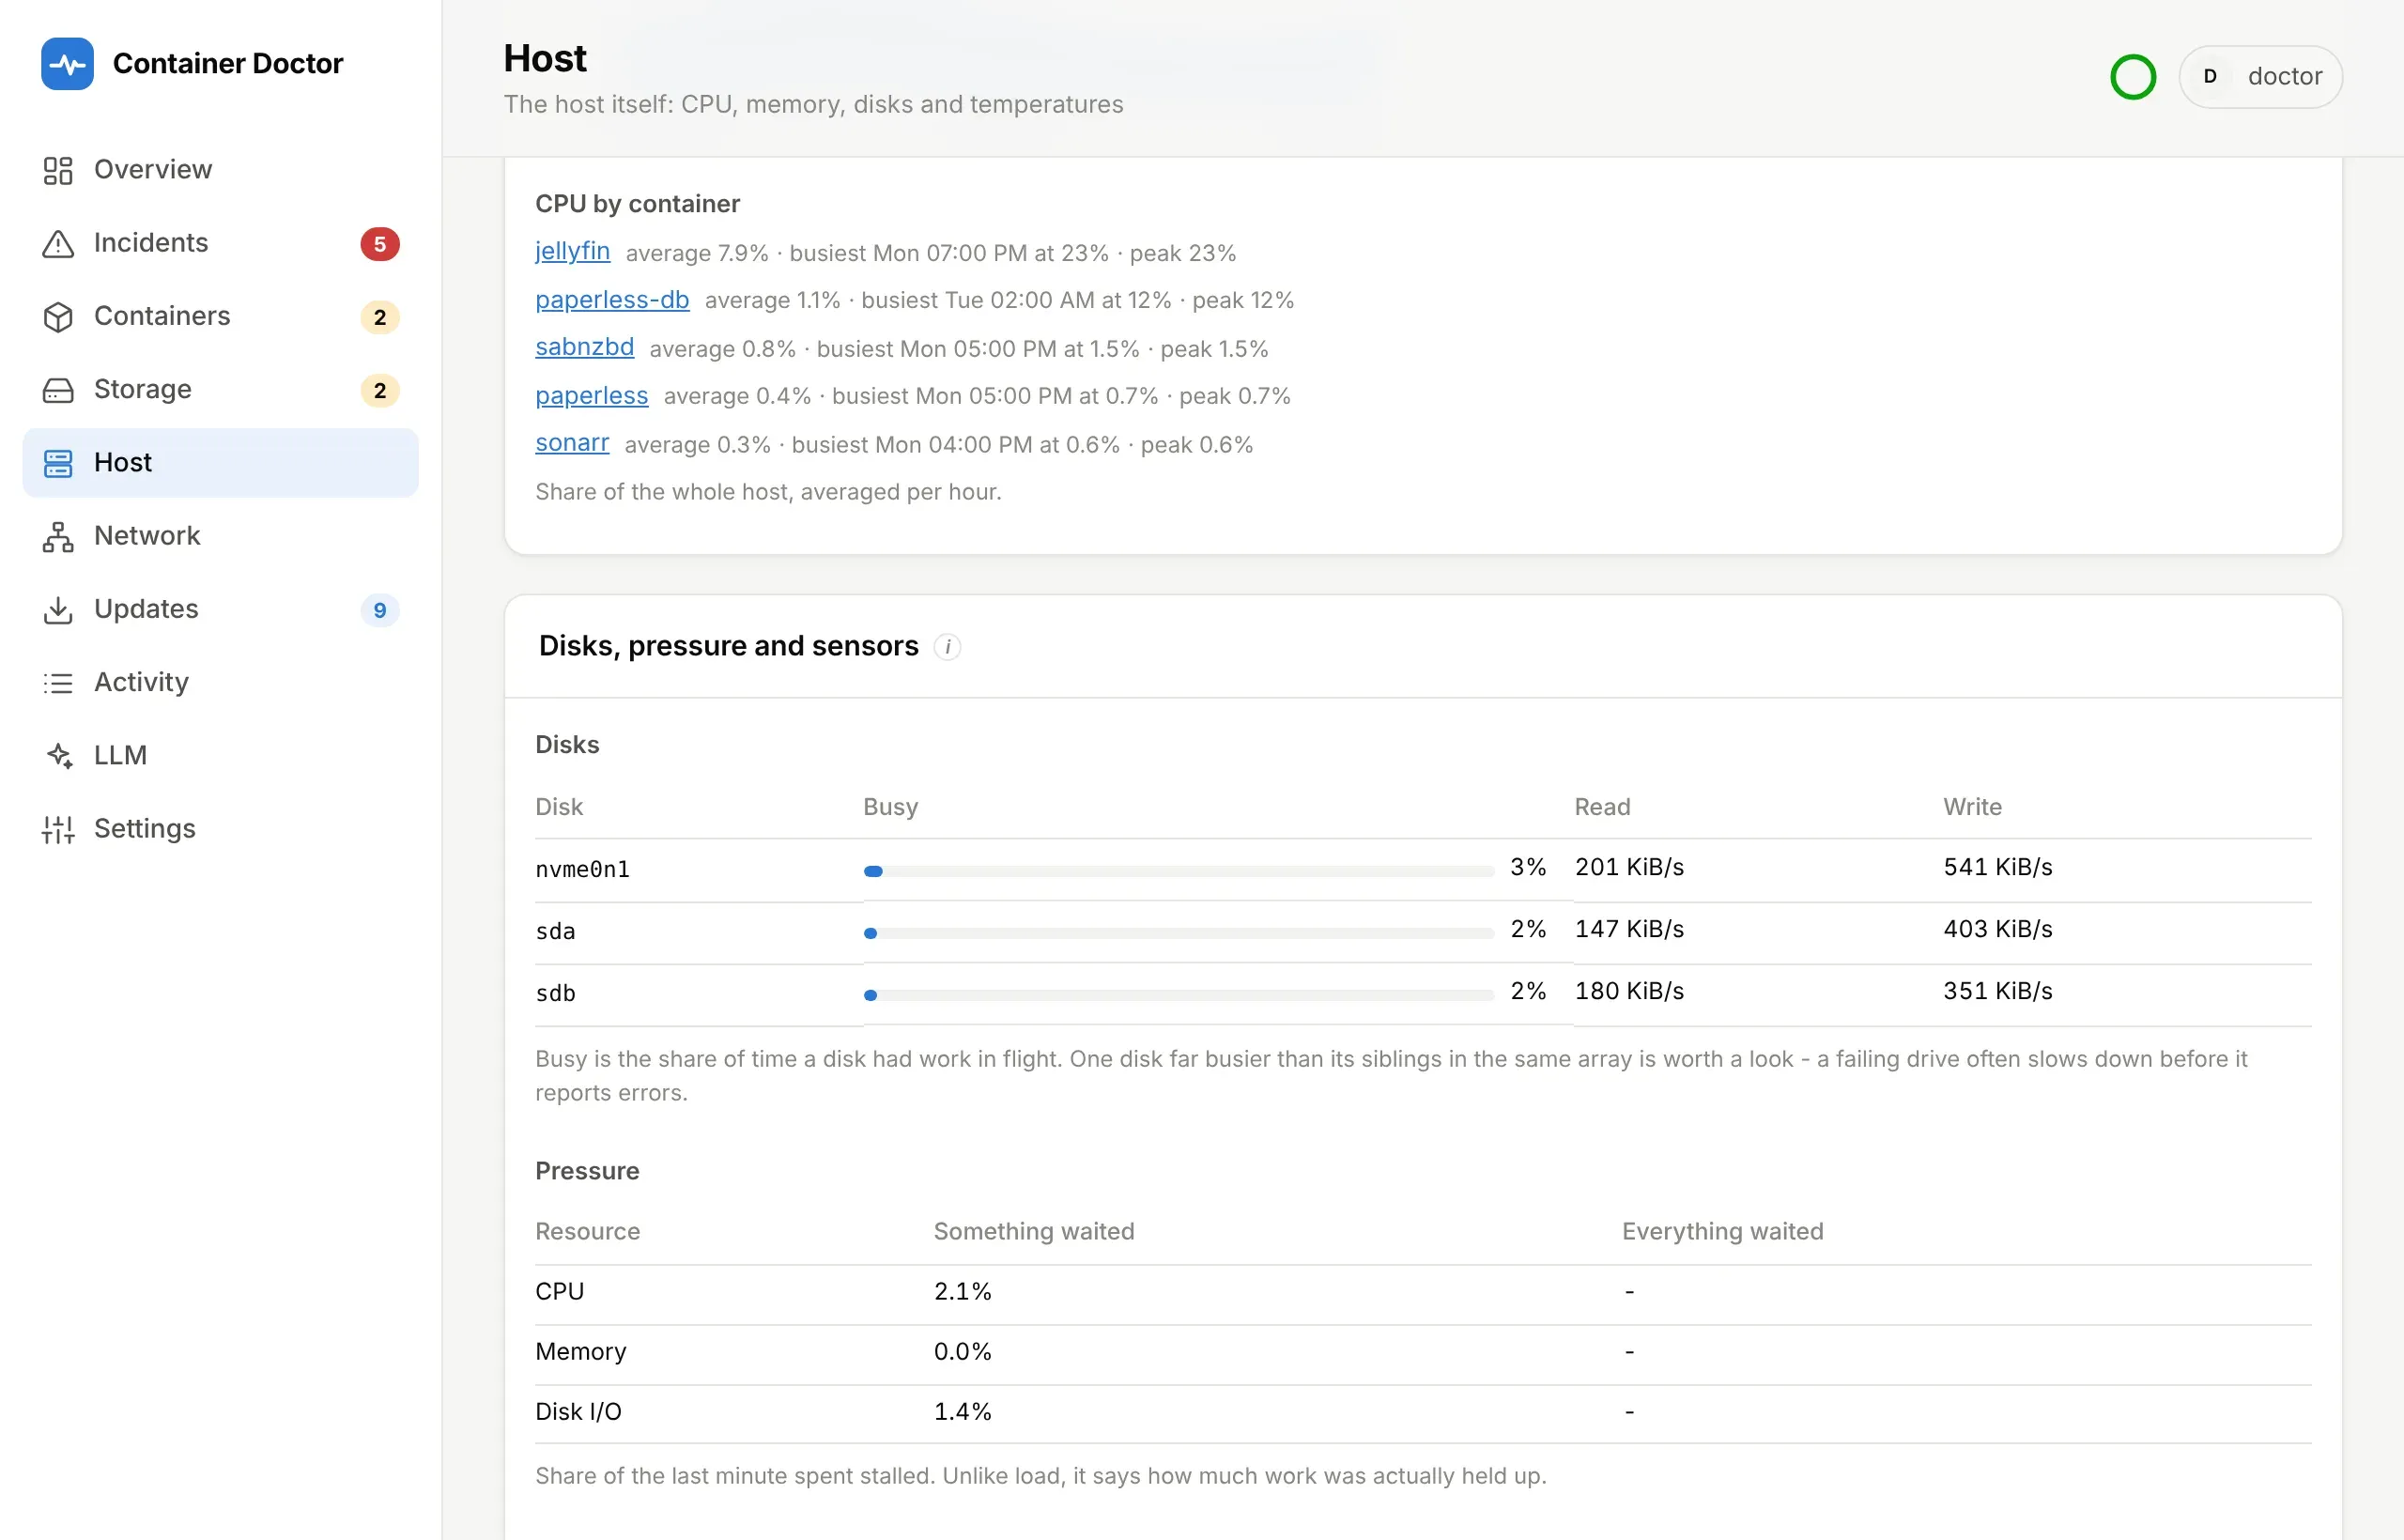
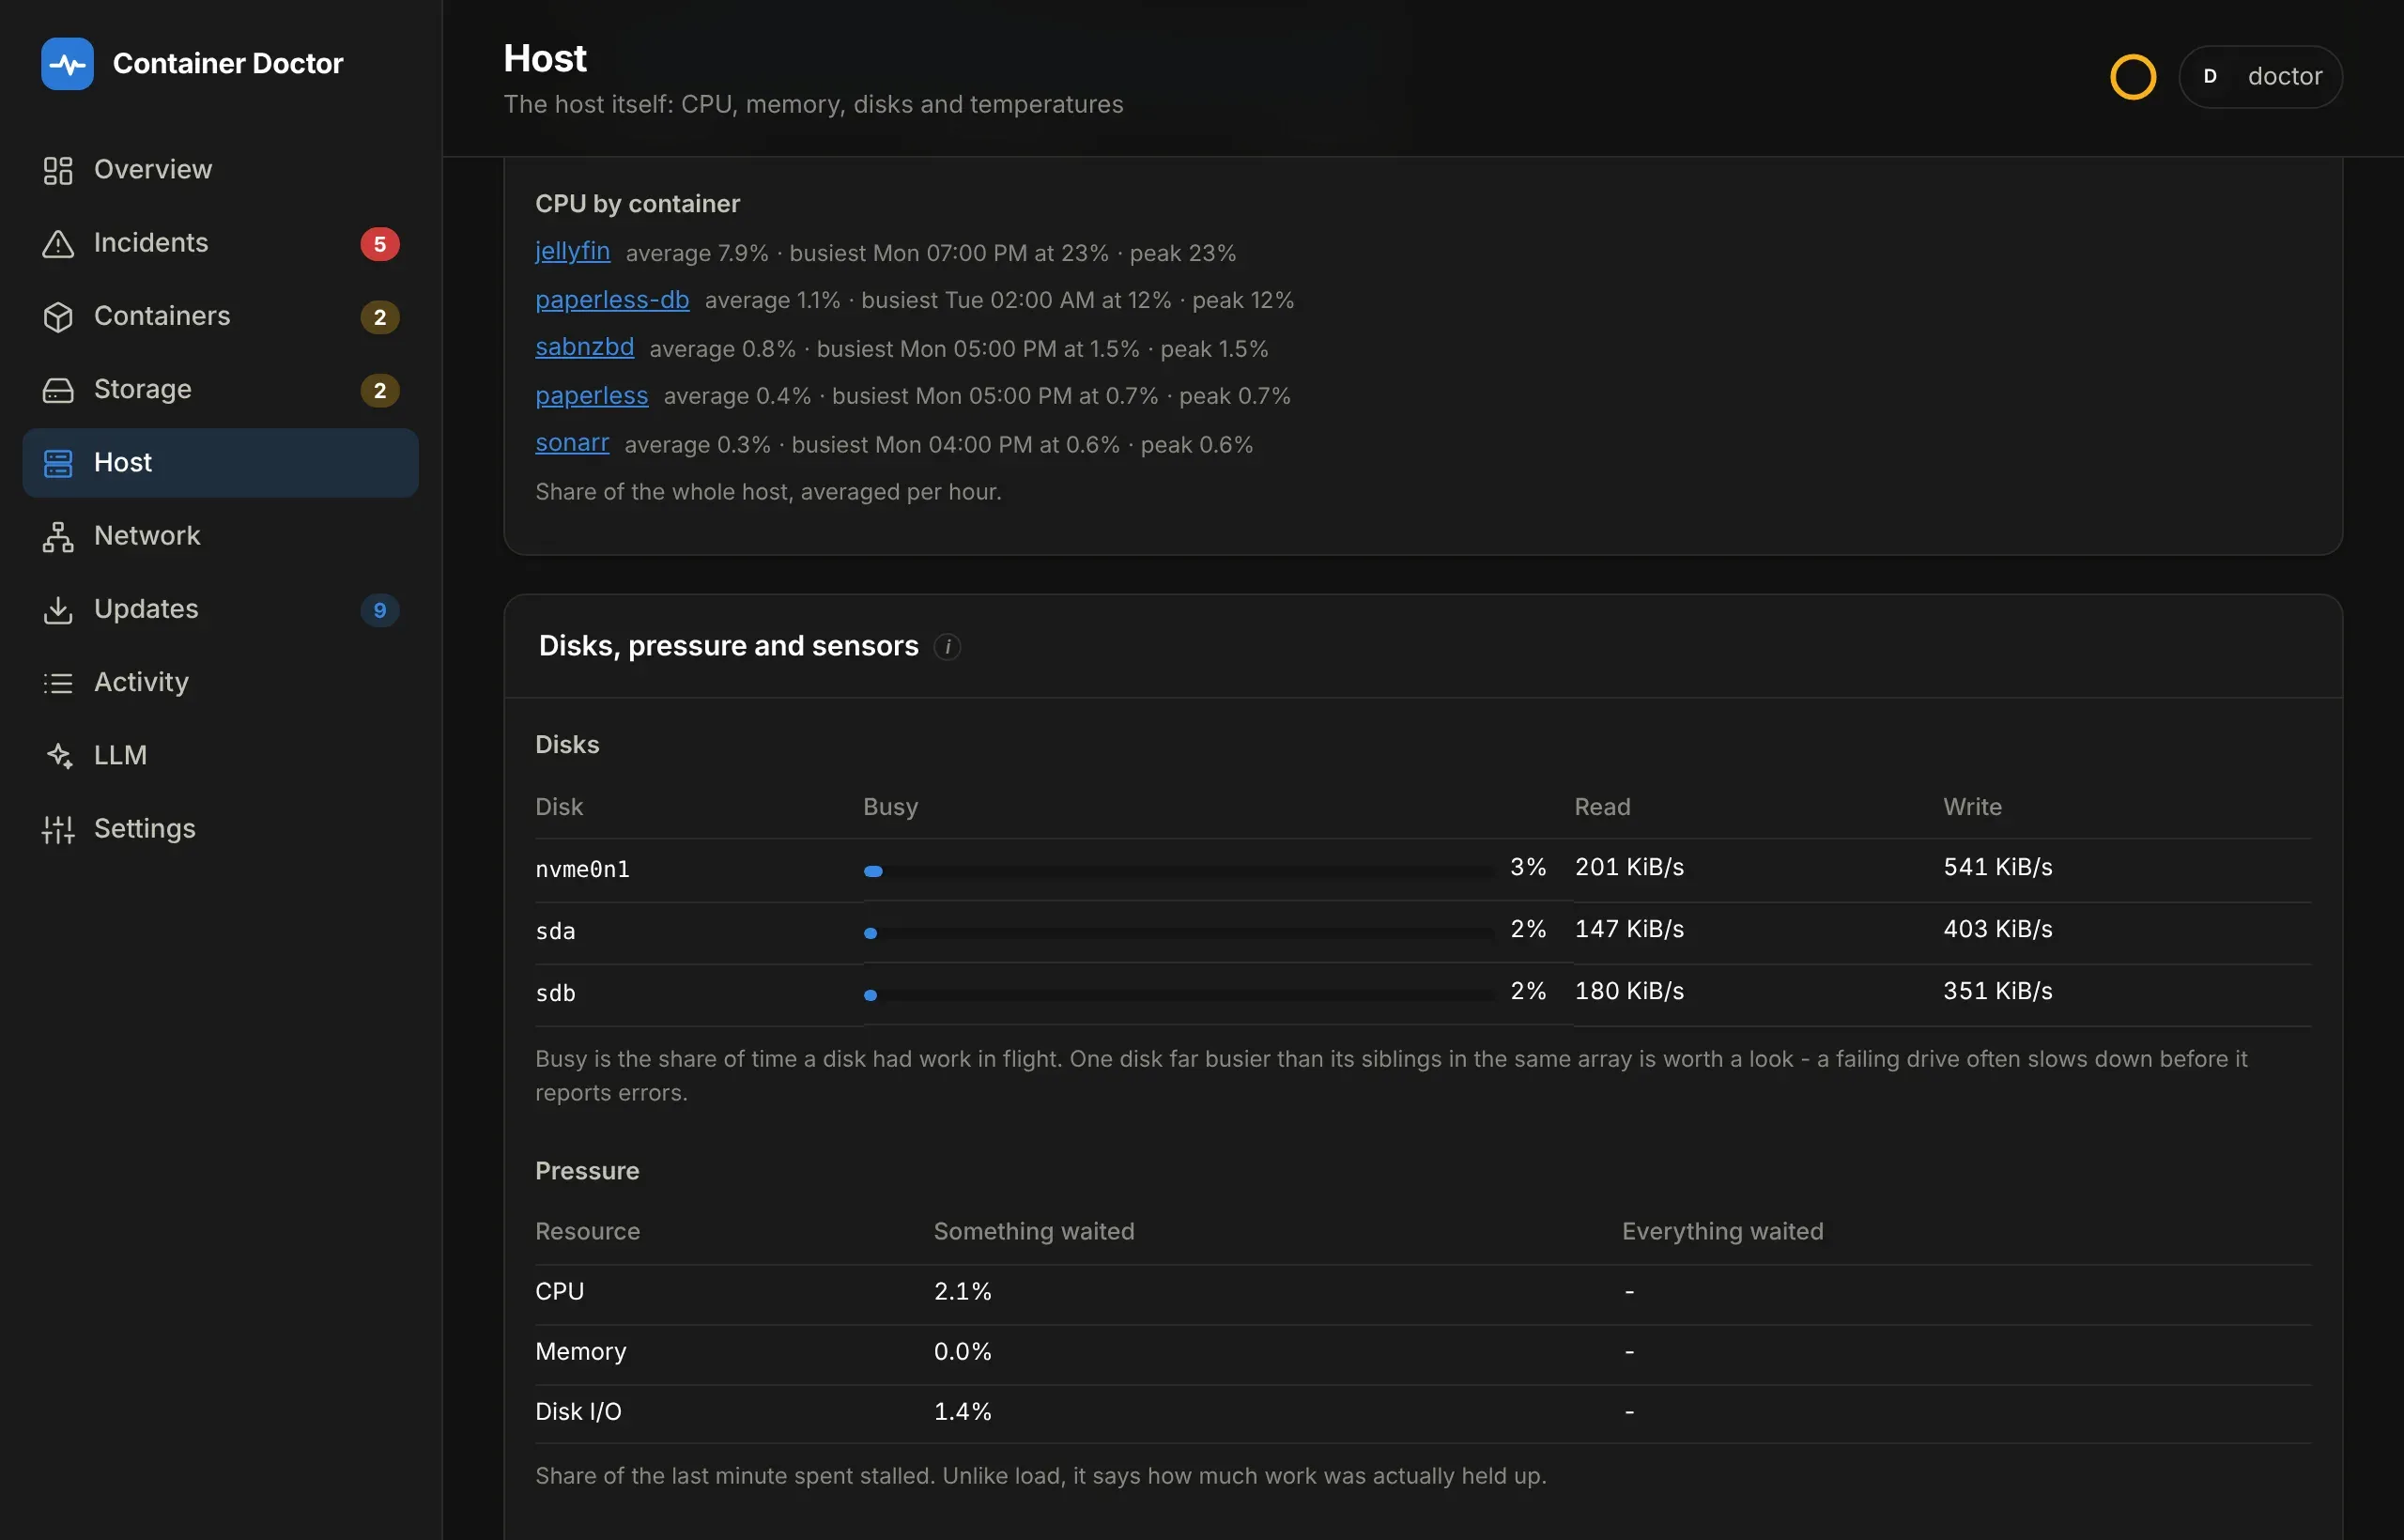
Section titled “Who used the CPU”Below the charts, CPU by container names the five containers that used the most CPU over the chosen range: each one’s average share of the host, its busiest hour and its peak. Each container’s CPU is kept per hour, as with its memory, so a busy night is still there to look at the next morning - the container’s own page has the same history for 14 days. A disk’s activity over time is on its drive’s page; see Reads and writes.