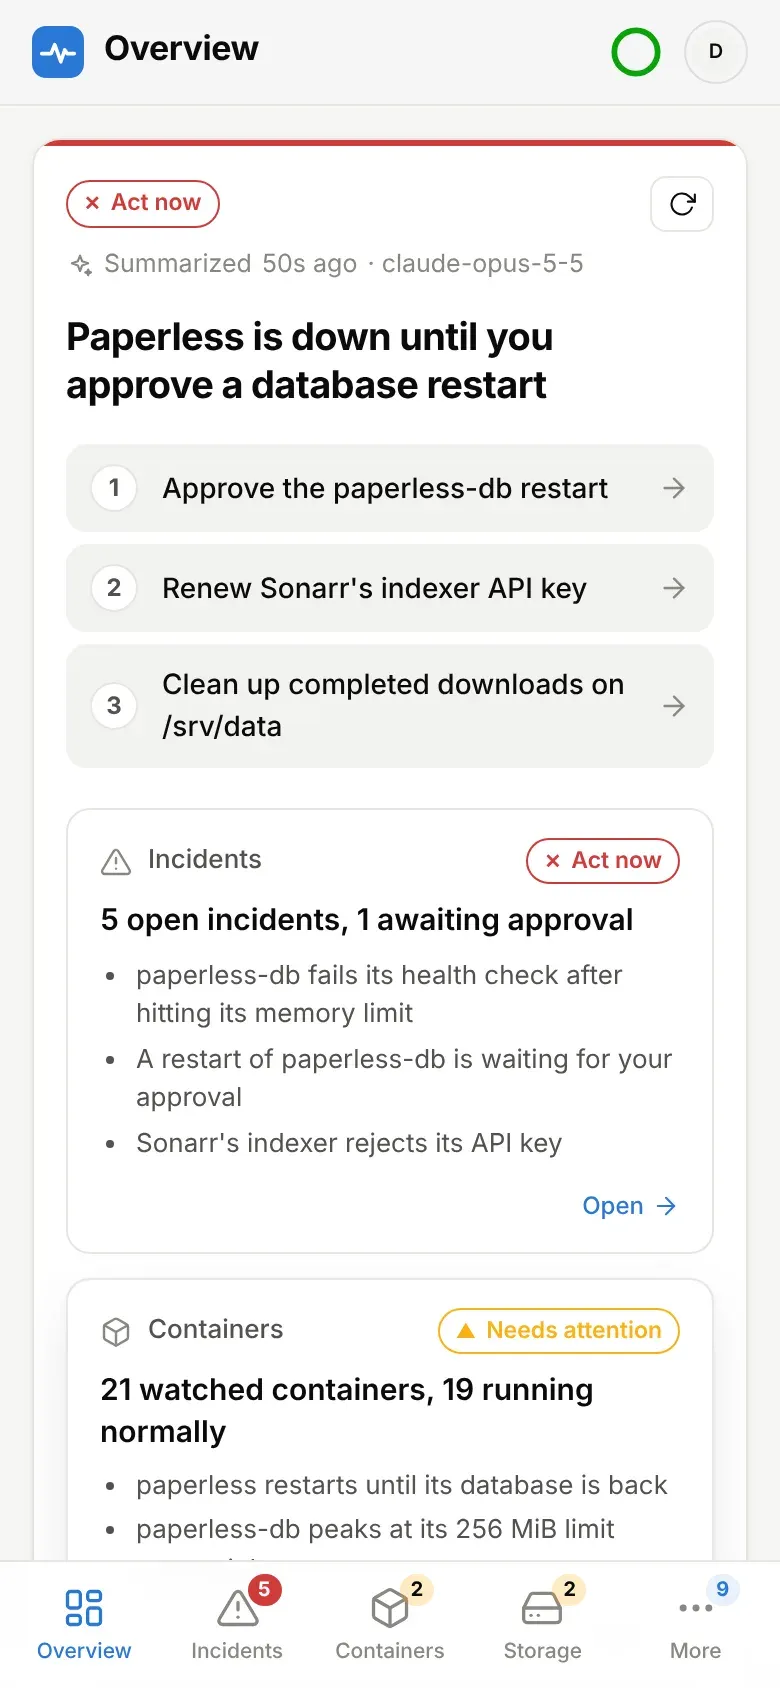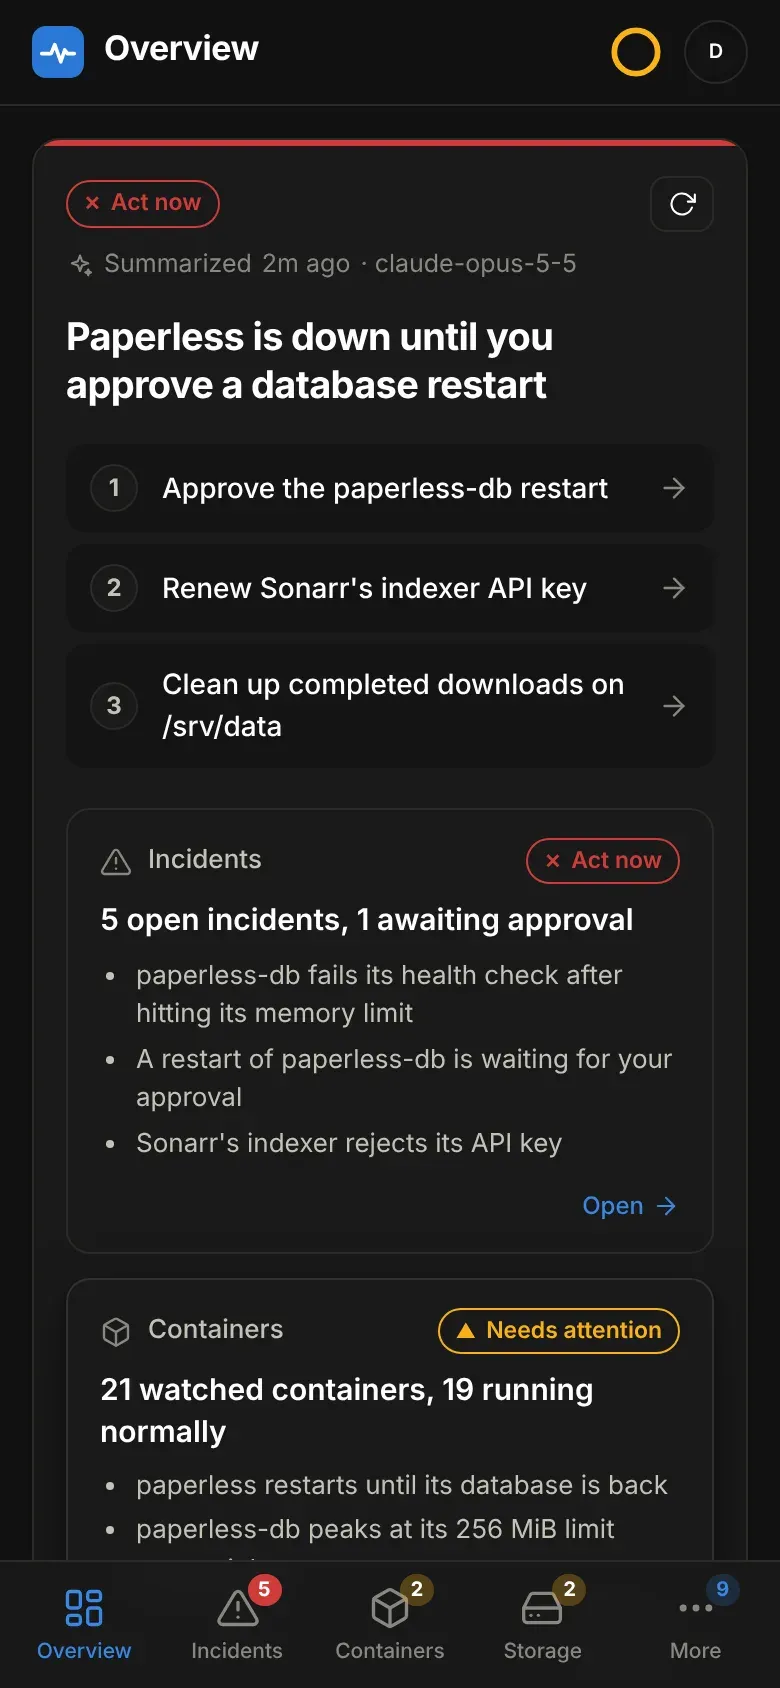
The dashboard
http://<host>:8080, or your own hostname behind a reverse proxy. It needs a
sign-in - the password (an HTTP Basic prompt at /auth/password) or OIDC; see
Sign-in - and updates live over server-sent events.
- Overview — the briefing, then the tiles: current mode, open incidents, actions waiting for you, and today’s LLM spend against the cap.
- Containers — every container with state, health, CPU and memory, which ones are watched, and a manual restart button; as a list or grouped by stack, and each with a detail view.
- Storage — free space and the fill forecast for the filesystems in
DOCTOR_DISK_PATHS, and the state of every disk array. - Incidents — the rule summary, the model’s root-cause analysis, confidence, the steps you should take, the evidence it used, and the redacted log tail as it was at detection. Approve / reject / dismiss / re-diagnose from here, plus the two log views below.
- Updates — images with a newer build of their tag, or a newer version, with their release notes on request and a redeploy button for new builds.
- Activity — the action log: every decision, including the ones deliberately not taken and why. This is the audit trail; nothing touches Docker without a row here.
- Settings — the running configuration, where each value comes from, and the place to change it. See Settings.
Without DOCTOR_WEB_PASSWORD or OIDC, nothing here is served at all: every
request is answered 403.
Reading the dashboard
Section titled “Reading the dashboard”The dashboard is one section at a time, picked from the sidebar — or the
tab bar at the bottom on a phone, with Updates, Activity and Settings under
More. Each section has its own address (#/incidents, #/storage…), so
the back button, a reload and a bookmark all land where you were, and each nav
item carries a count when its section wants a look: open incidents, containers
that are down or unhealthy, storage problems, images behind.
Every list — incidents, containers, storage, updates and the action log — has a switch in its header between the full view and compact rows: one line per item, three pages’ worth at a time, for reading thirty containers at a glance. Compact containers show state, name, image, CPU, memory and restarts; storage drops the charts; updates drop the release-note warnings; the action log keeps each reason as the row’s tooltip. An incident still opens in full from its compact row. The choice is remembered per list, in this browser.
The briefing
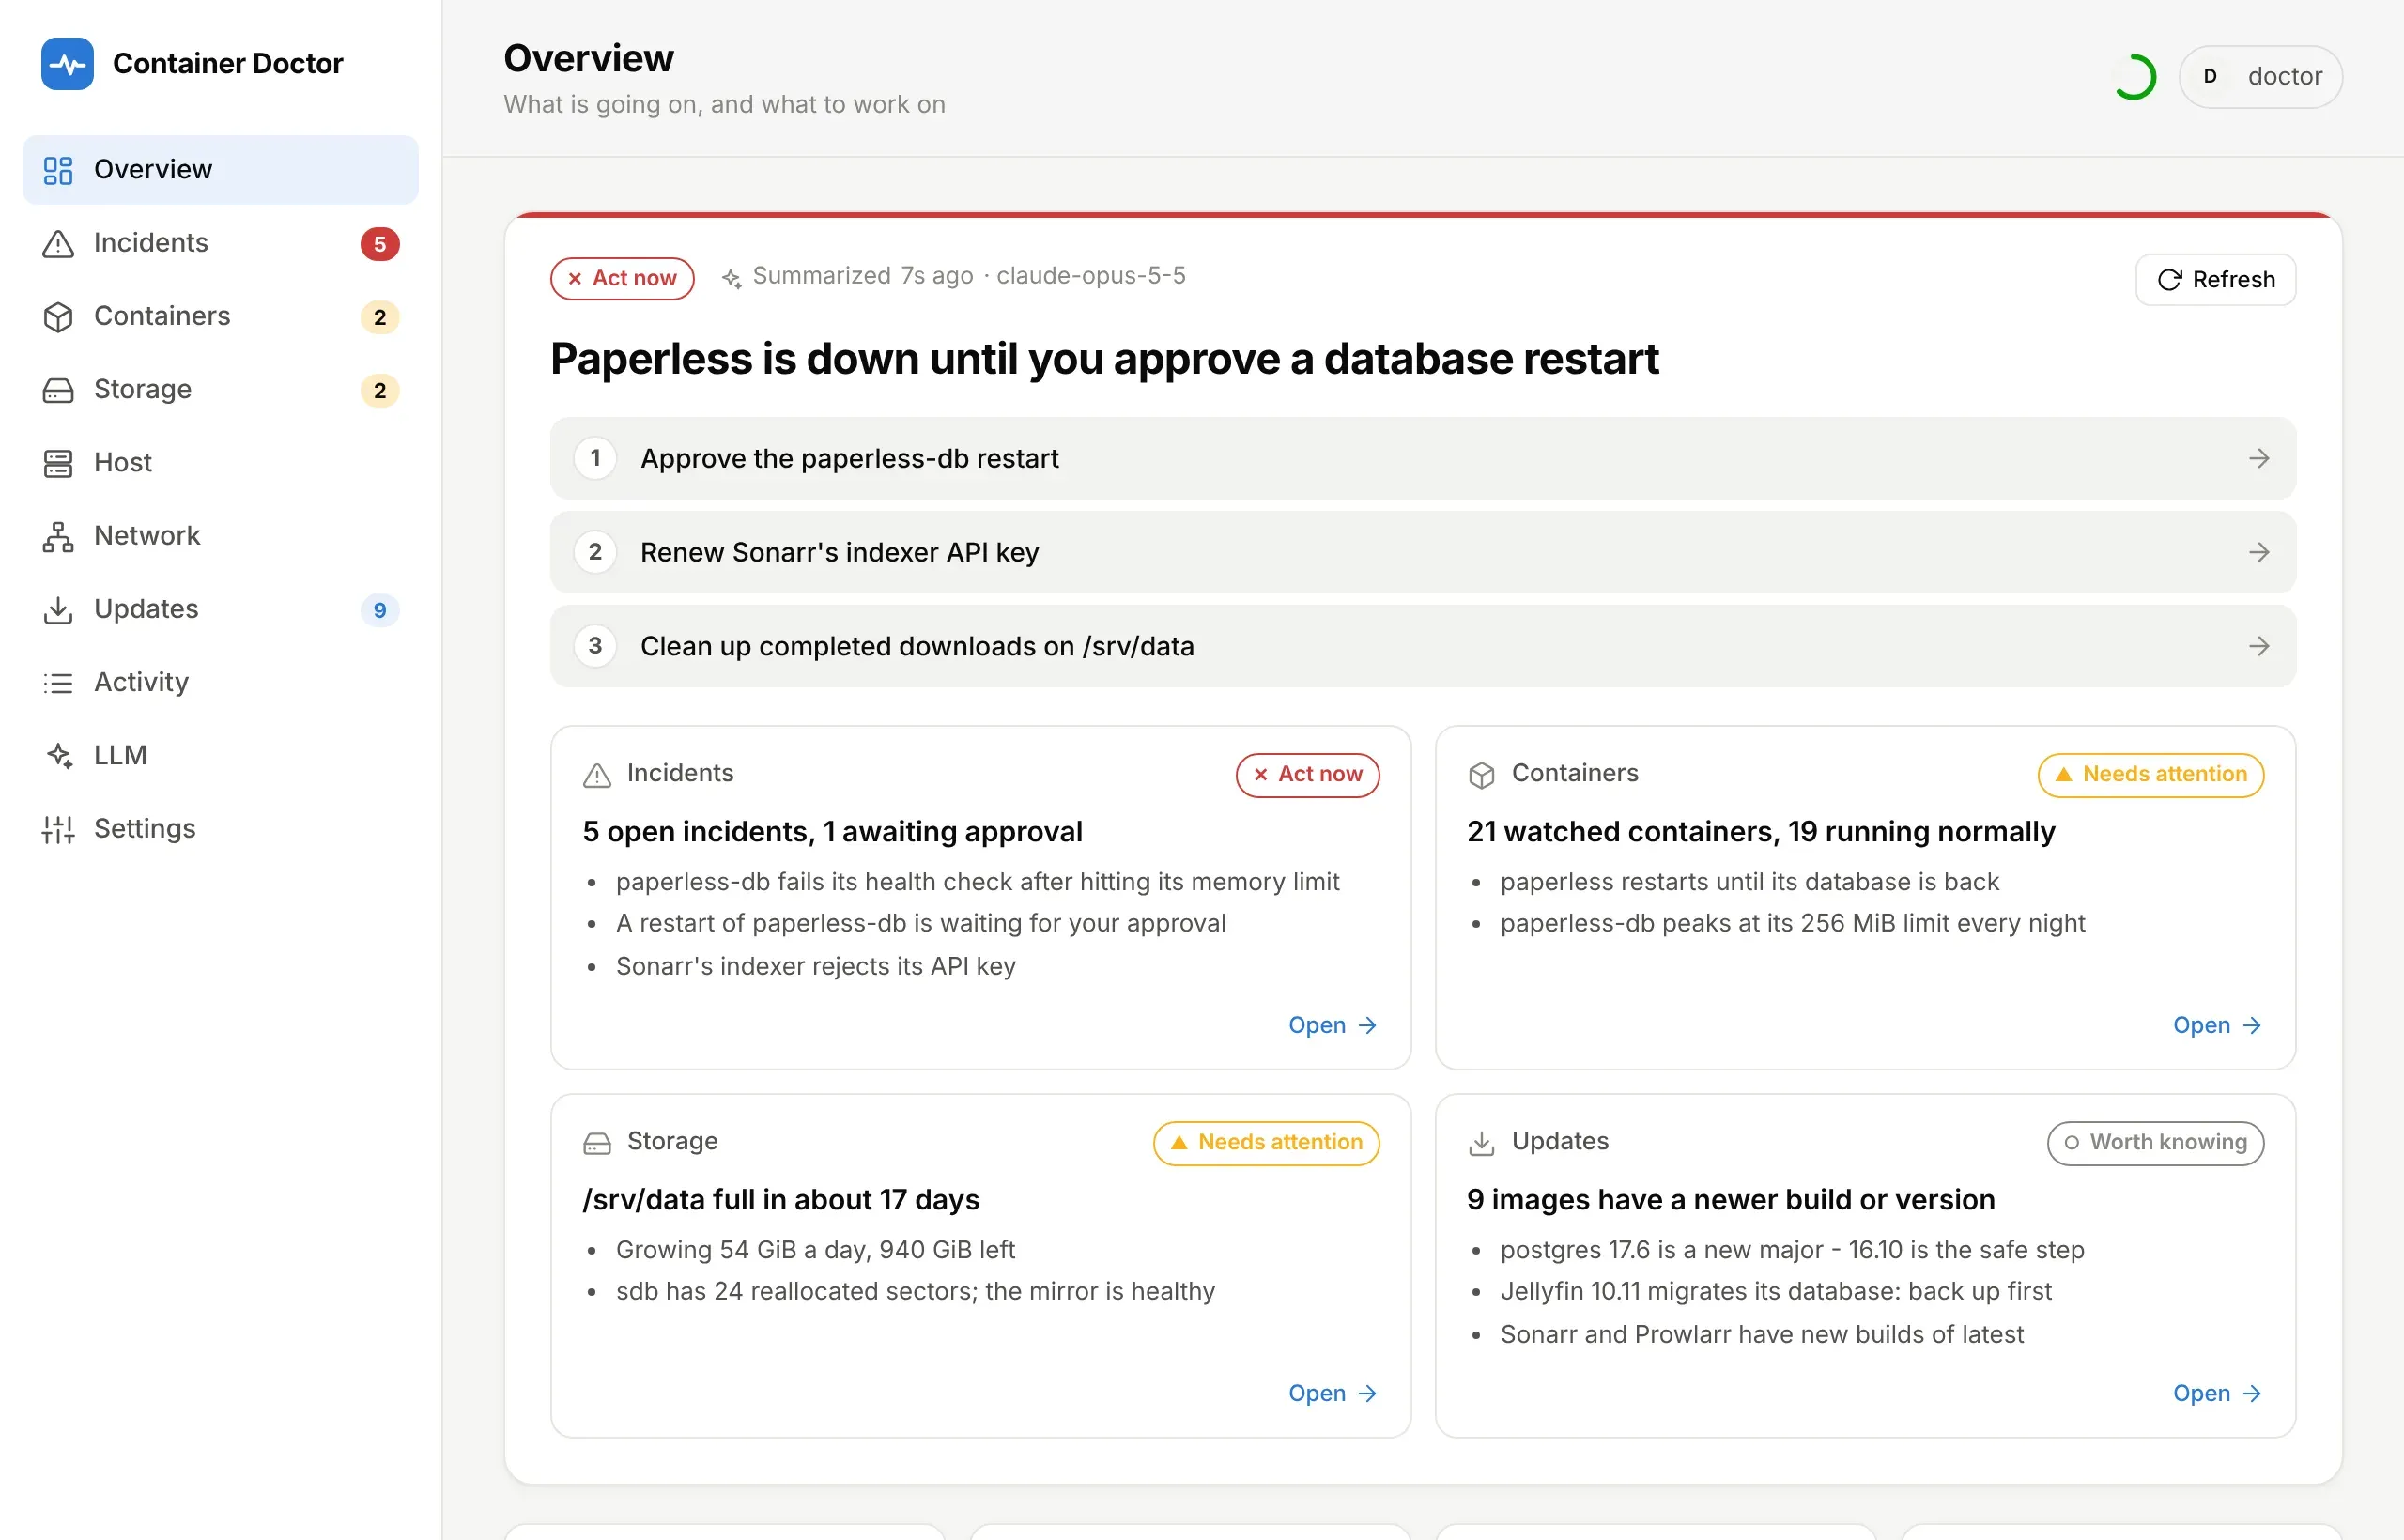
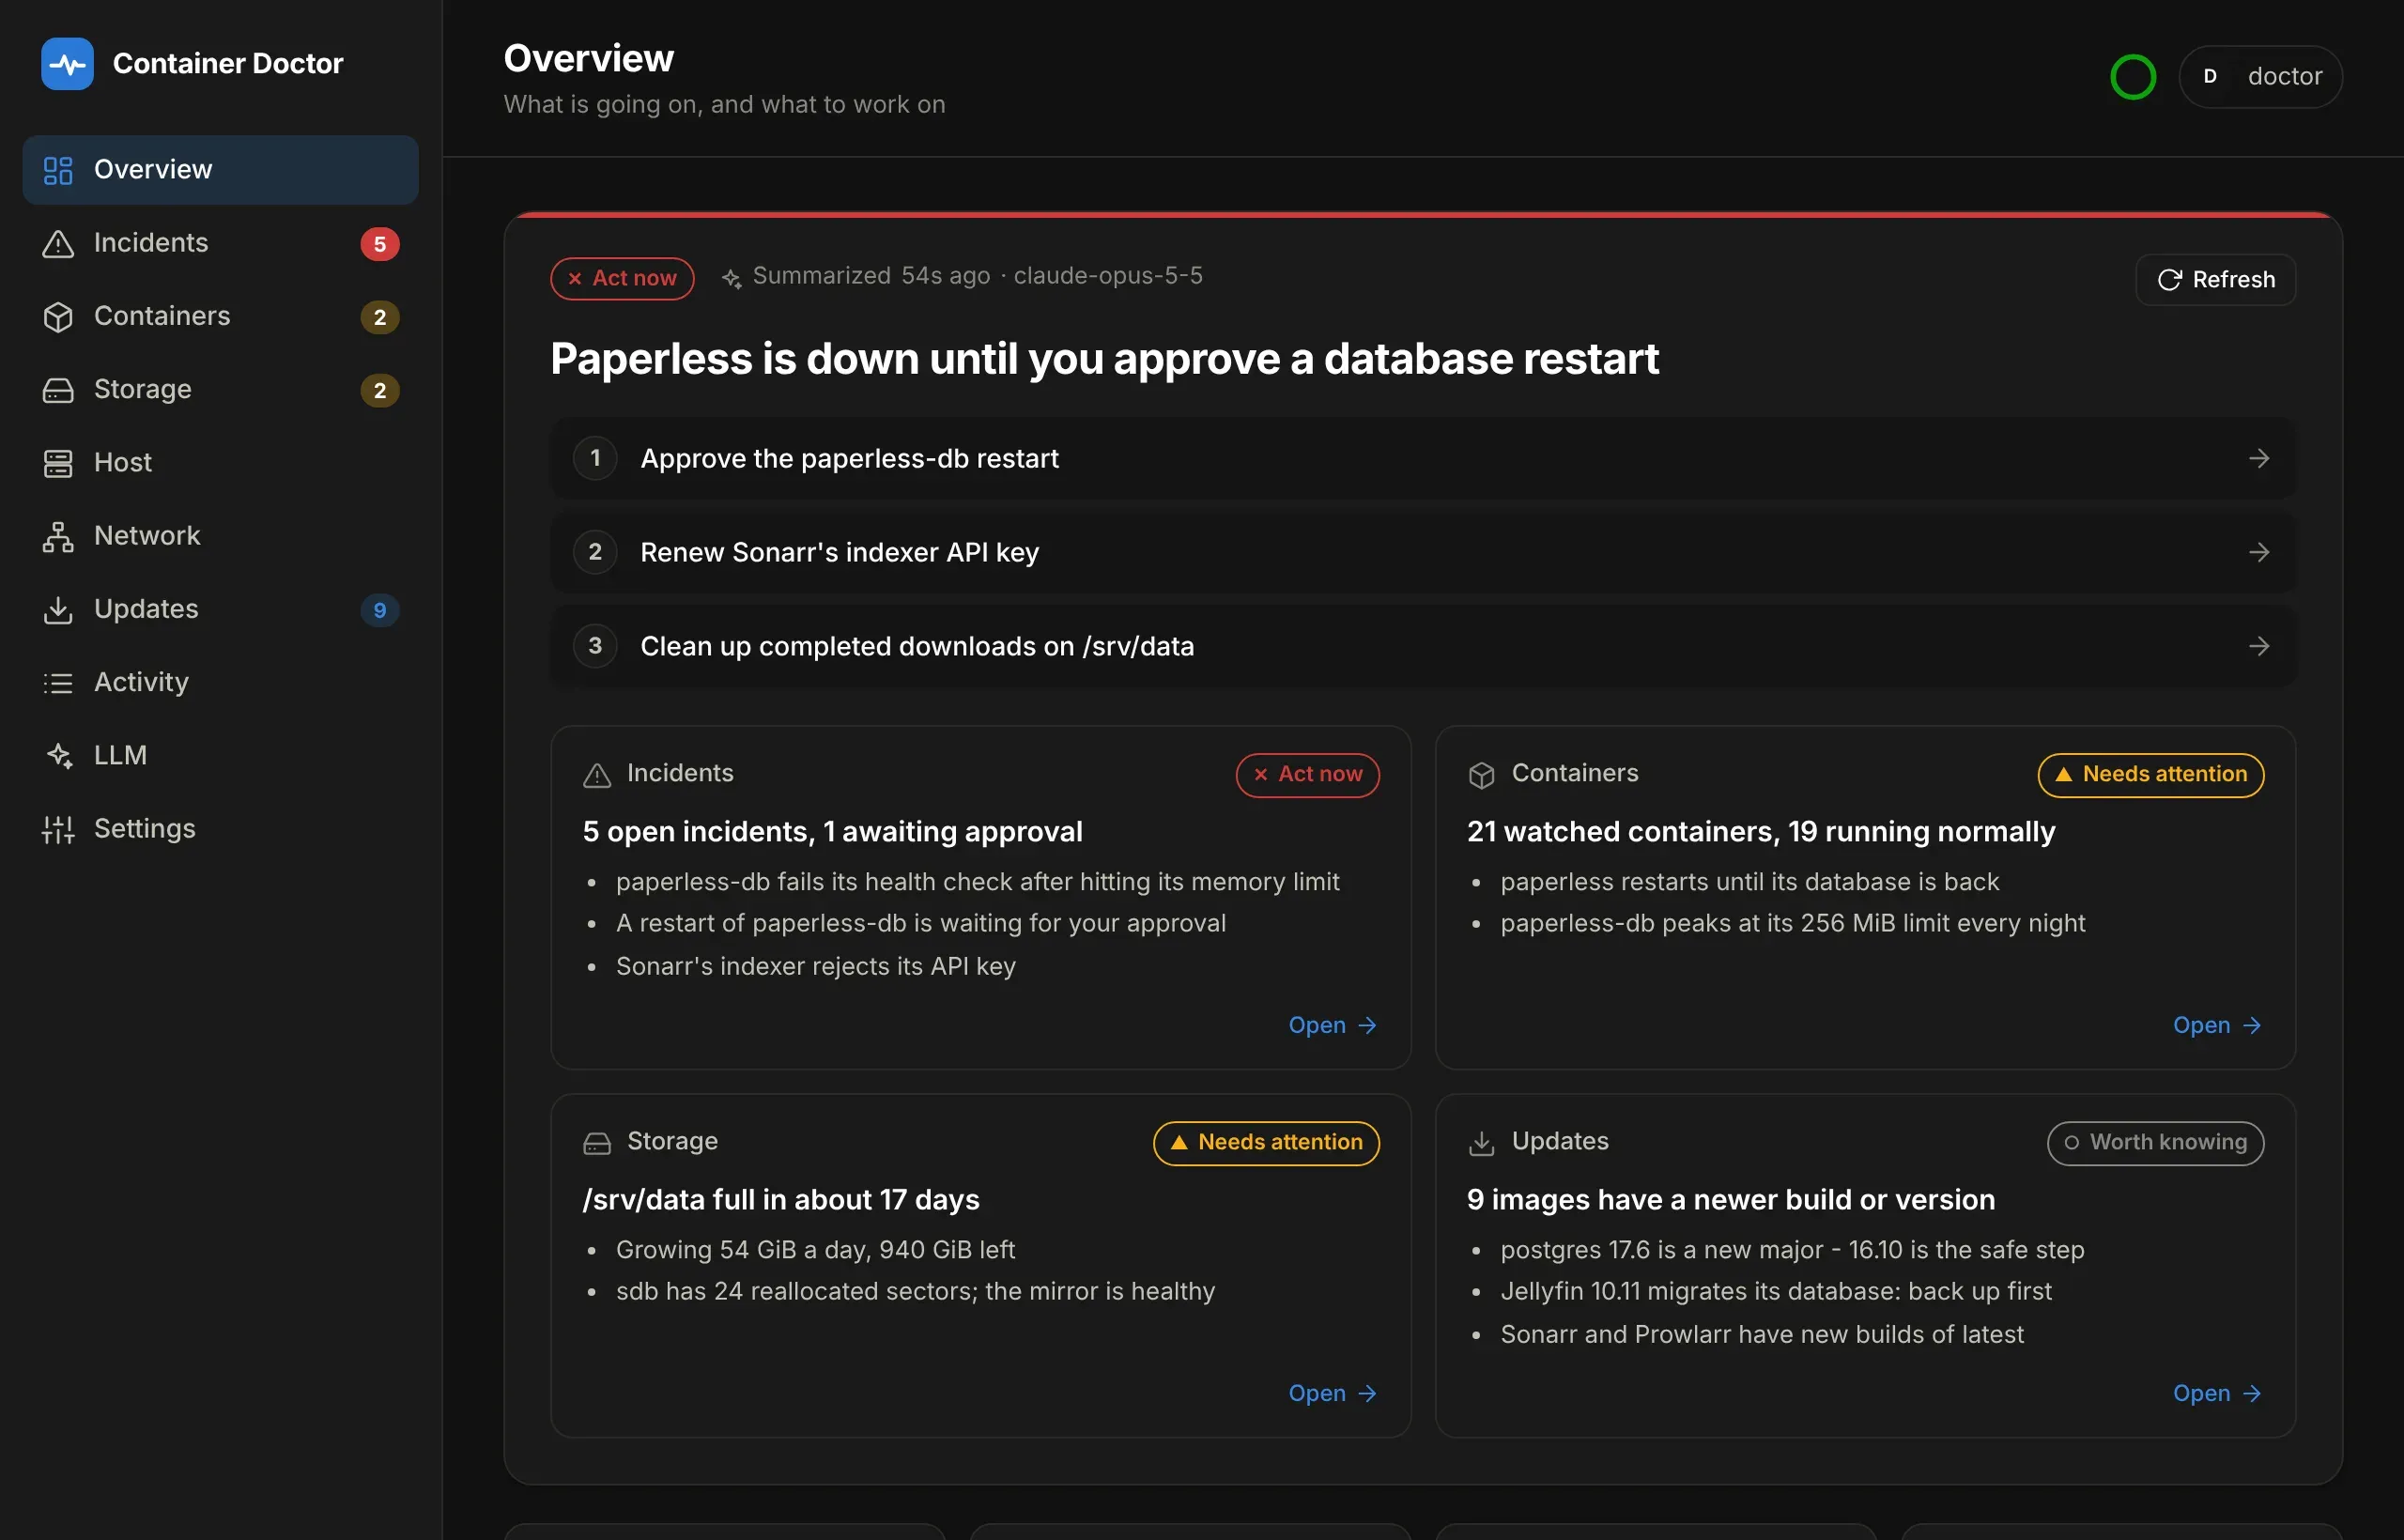
Section titled “The briefing”Overview opens with a summary of the whole host: a headline, up to three things to work on — each linked to the incident, container or page it is about — and a card per section with its state and the few points that matter.
It is built in two layers so it can be both cheap and right:
- Facts, computed without a model from what the doctor already holds: which incidents are open and how bad, which containers are down, how full each disk is and how fast it is going, which arrays are rebuilding, which images are behind. Each section gets a level from the same rules the incidents use.
- Summaries: one small model call per section turns its facts into a headline and up to three points, and a last one reads those and picks the priorities. The model may only link to things the facts listed.
Every summary is cached in SQLite against a fingerprint of the facts it was
written from, so a reload — or a restart — shows the same words and costs
nothing. The fingerprint leaves out what moves without anything happening: CPU,
an incident’s sighting count, a disk’s fill to less than 5%. When a section’s
facts do change it is rewritten at most every DOCTOR_BRIEFING_REFRESH_MINUTES,
and marked out of date meanwhile — unless its level changed, because a new
critical incident should not wait. Refresh rewrites everything now.
It never competes with a diagnosis: the briefing stops at 80% of either daily cap, leaving the rest for incidents, and says so on the card. With the summary turned off, or no model configured, the facts stand on their own: the same cards and a headline built from them, with no model’s words anywhere.
| Variable | Default | What it does |
|---|---|---|
DOCTOR_BRIEFING |
true |
false turns the summary off; the facts remain |
DOCTOR_BRIEFING_MODEL |
DOCTOR_MODEL |
A smaller model is plenty for three lines |
DOCTOR_BRIEFING_REFRESH_MINUTES |
15 |
How often a section may be rewritten when its facts change but its level does not |
Reading the rest
Section titled “Reading the rest”The ring in the top bar is the poll. It fills over one poll interval and empties when the next poll lands, so a doctor that has stalled shows as a ring that stopped emptying. Green is connected, amber is a poll well overdue, red is Docker unreachable or the page’s own connection lost. Hover or tap it for the time of the last poll and how long it took.
Polls start every DOCTOR_POLL_INTERVAL seconds, measured from the start of one
to the next, and read up to DOCTOR_POLL_CONCURRENCY containers (default 6)
at once: docker stats waits a second for its CPU sample, so a few dozen
containers read one at a time would take over a minute. Poll now on the
Containers page reads Docker straight away instead of waiting for the next one.
When the dashboard cannot reach the doctor at all - typically a phone that has
dropped off the VPN with the app still open - a banner says so instead of a
toast per failed request. The last data seen stays on screen, dimmed and
stamped with its time, and the page keeps checking /healthz (sooner when
the app comes back to the front or the device goes online), picking up where
it left off once it answers. A 502-504 from the proxy reads as restarting
instead. Opening the installed app with no connection at all shows a small
offline page of its own, from a service worker that caches nothing else, which
opens the dashboard as soon as it can reach it.
Each tile is a way in: Incidents and Awaiting approval open the incident list already filtered to them, Mode goes to Settings, and LLM usage goes to the LLM page with its spend chart and call log.
The Incidents tile shows what is still open — anything not resolved or dismissed, including whatever is awaiting approval — above the count opened in the last 24 hours. Two numbers because they answer different questions: one is your queue, the other is what the rules did.
The incident filters default to Open, which is why dismissing something makes it leave the list; it stays reachable under Dismissed and All. Open deliberately includes awaiting-approval.
Storage shows each watched path’s fullness, how fast it is moving and the forecast chart, and the disk arrays below it. Image updates appears after the first registry check and lists only what is behind; Check now in its header asks the registries again without waiting for the next scheduled check (at most once a minute, since Docker Hub rate-limits anonymous callers), and spins until the answers are in — twenty-seven “up to date” rows are the reason nobody reads a list like that.
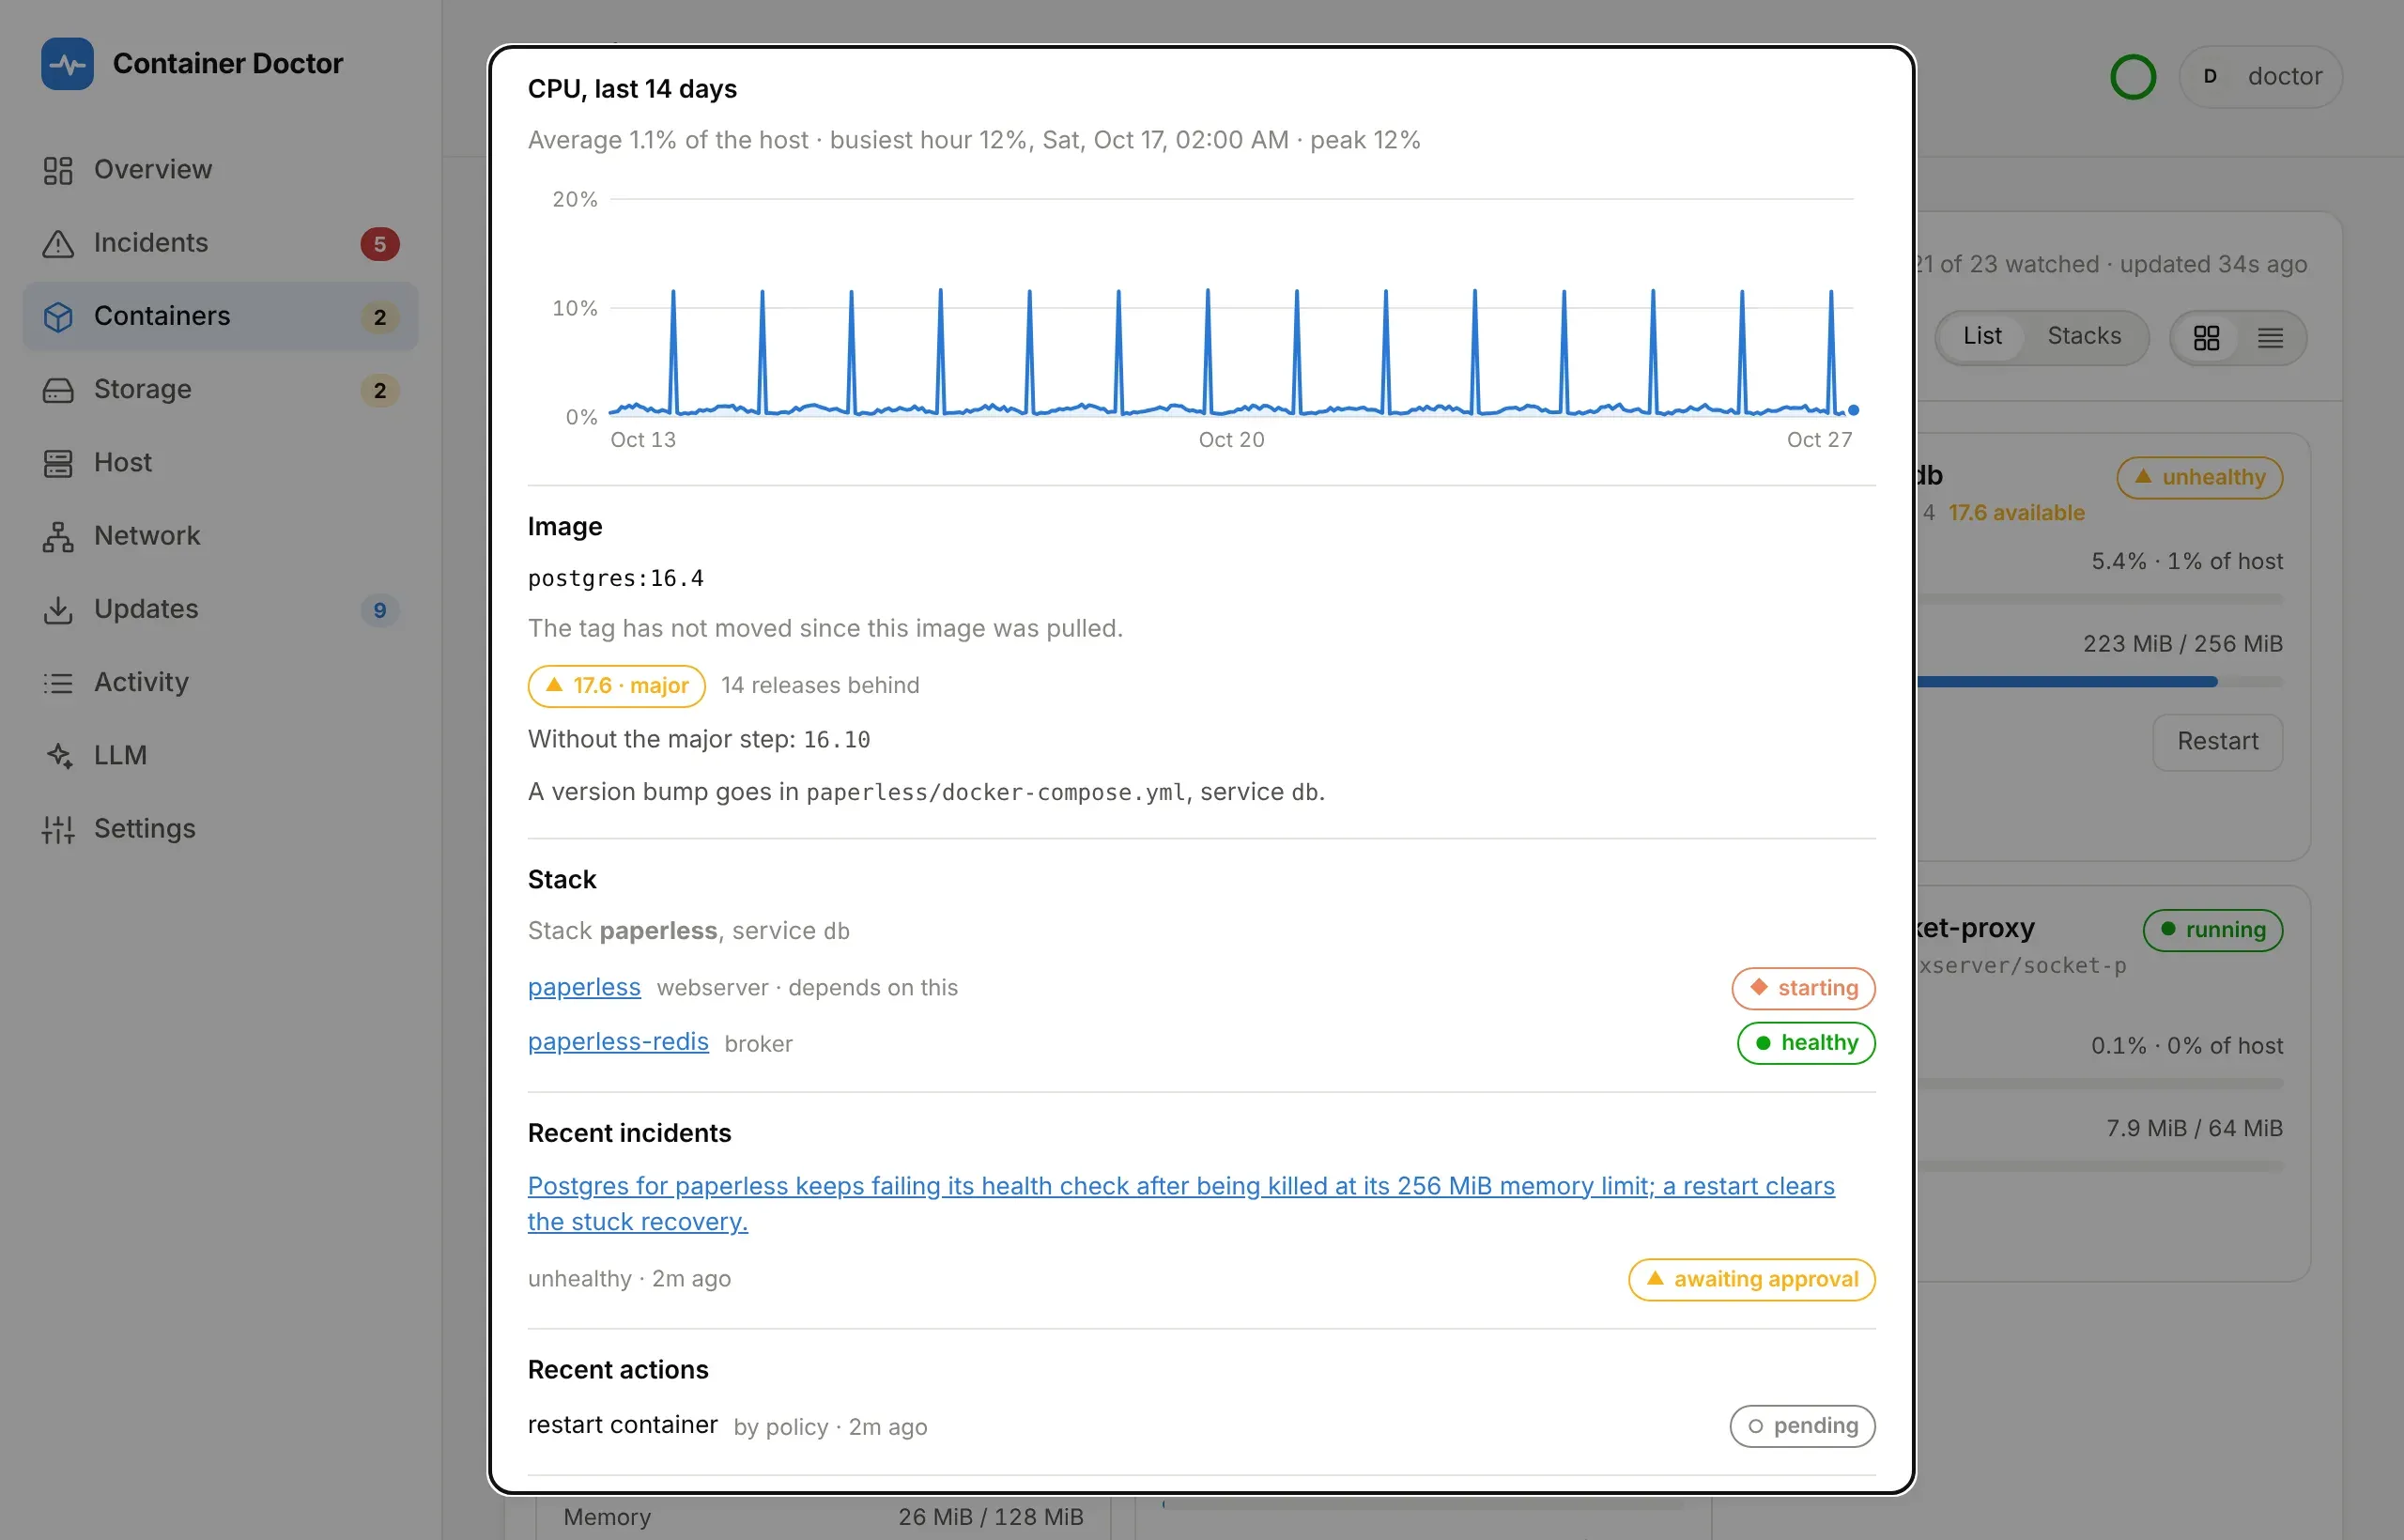
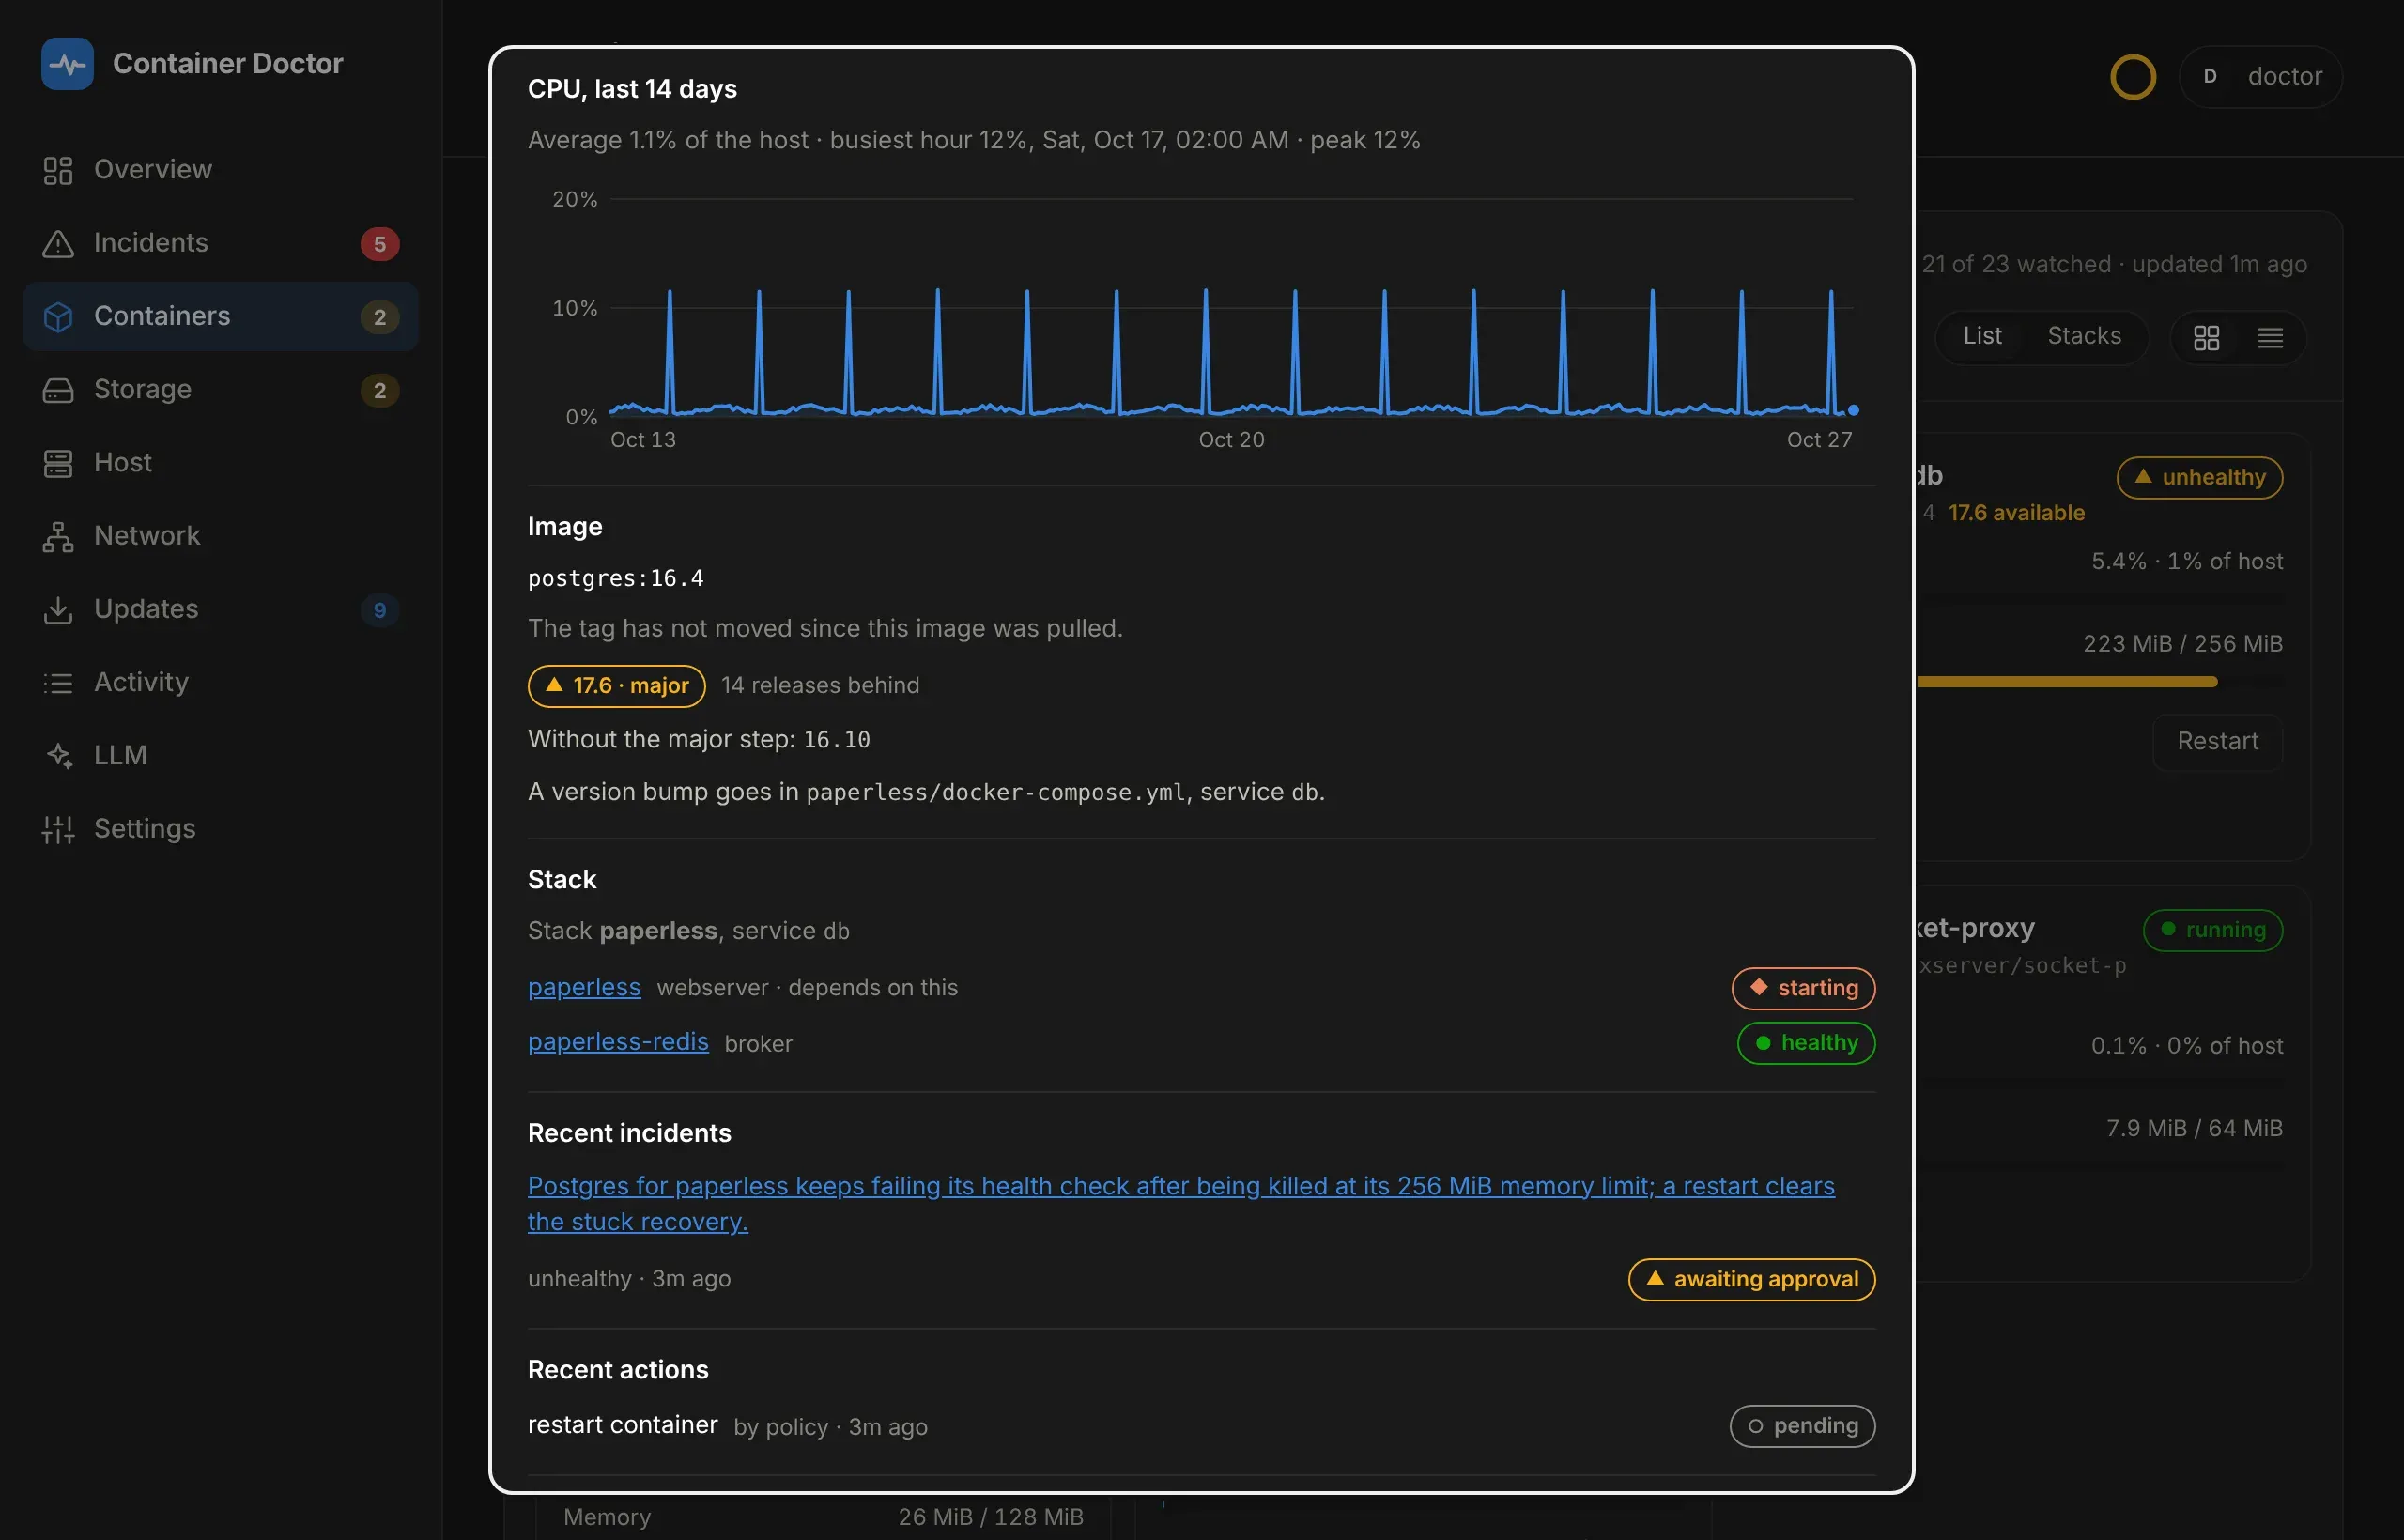
Click a container for its own view: CPU and memory for the last day (a
point a minute, kept in memory, so it starts over when the doctor restarts), its
recent incidents and actions, what its image is behind on, the rest of its
Compose stack with who depends on whom, and its doctor.* labels. Other labels
are left out on purpose — Traefik rules and Homepage widget keys are not the
doctor’s to show. It has its own address, #container/<name>, so it survives a
reload and can be linked to.
Stacks at the top of the container panel groups containers by Compose project. Stacks with something unwell sort first and open; the rest collapse to one line each, which on a phone is the difference between one screen and ten. The choice is remembered per browser.
Every list starts short — eight containers, ten incidents, ten actions, five image updates — with Show more and Show fewer under it and a count of how many there are. On a phone the long version was several screens of scrolling before the action log. Anything unwell sorts to the top first, so it is always on the first page.
The action log puts each reason on a line of its own, clamped to two lines with a more toggle where it was actually cut — which depends on the width, so a desktop usually shows none.
The ⓘ next to a heading explains what that panel counts. Settings lists the running configuration - and changes it; see Settings. The colour theme is chosen there too, and remembered per browser.
From a notification to the incident
Section titled “From a notification to the incident”With DOCTOR_PUBLIC_URL set — OIDC sign-in needs it anyway — every ntfy
notification opens the incident it is about rather than the top of the
dashboard, and carries a button: Review and approve when an action is
waiting, Open incident otherwise. The incident is opened, scrolled to and
marked, whatever filter the list is on. If the browser is signed out, the link
is kept through the sign-in round trip and put back afterwards.
Copy link on any incident gives the same address, #incident/<id>.
Finding a container among thirty
Section titled “Finding a container among thirty”The container panel filters by name or image, and Only issues hides everything healthy. Whatever the filter, anything stopped, unhealthy or still starting sorts to the top — so the thing that needs you is never behind a screenful of containers that are fine.
A container’s history
Section titled “A container’s history”A container’s page charts its CPU and memory minute by minute for the last 24 hours, from memory, so it starts over when the doctor restarts. Below that, two histories kept in the database: Memory, last 14 days, the hourly peaks behind the memory-limit suggestions, and CPU, last 14 days, the hourly average as a share of the whole host, with its busiest hour - the job that keeps the host busy at night shows up there.
Which build is running
Section titled “Which build is running”Settings → Build and mode shows the release the running image was built
for - 1.2.0, set by the Release workflow as DOCTOR_VERSION - and the commit
it was built from, aae1b80. Compare them with the latest release, or with
main, to tell whether a deploy actually landed.
This matters because “the deploy succeeded” and “the new code is running” are different claims: a redeploy that does not pull recreates the container from the image already on the host and reports success, leaving the old build in place. The stamp is baked into the image rather than passed through the compose file, so it reports the image’s identity: a compose variable would come fresh from git on every deploy and read as current even while a stale image ran.
A local build with no stamp reads dev rather than a commit, and an image
built from main rather than a release shows no version.
On the phone’s home screen
Section titled “On the phone’s home screen”The dashboard installs as an app: Add to Home Screen in Safari, Install app in Chrome. It opens full-screen with its own icon, and a notification link opens straight into it. Its service worker does one thing: opened with no connection at all, it shows a small offline page that says so and opens the dashboard once it can reach it. It caches no data and none of the dashboard: a monitoring page that shows cached state when it cannot reach the doctor would be worse than one that says it cannot.